| Param | Original file | Final file |
|---|---|---|
| Filename | modeM0/AS1A09_038T04_9000003802cztM0_level2_bc.evt | modeM0/AS1A09_038T04_9000003802cztM0_level2_quad_clean.evt |
| Size (bytes) | 253,209,600 | 109,437,120 |
| Size | 241.5 MB | 104.4 MB |
| Events in quadrant A | 1,140,589 | 735,370 |
| Events in quadrant B | 1,197,611 | 747,947 |
| Events in quadrant C | 2,705,721 | 701,542 |
| Events in quadrant D | 2,215,151 | 717,194 |
| Mode M0 | |||
|---|---|---|---|
| Quadrant | BADHDUFLAG | Total packets | Discarded packets |
| A | 0 | 11995 | 0 |
| B | 0 | 12069 | 0 |
| C | 0 | 18374 | 0 |
| D | 0 | 15058 | 0 |
| Mode SS | |||
|---|---|---|---|
| Quadrant | BADHDUFLAG | Total packets | Discarded packets |
| A | 0 | 120 | 0 |
| B | 0 | 120 | 0 |
| C | 0 | 120 | 0 |
| D | 0 | 120 | 0 |
| Mode M9 | |||
|---|---|---|---|
| Quadrant | BADHDUFLAG | Total packets | Discarded packets |
| A | 0 | 1 | 0 |
| B | 0 | 1 | 0 |
| C | 0 | 1 | 0 |
| D | 0 | 1 | 0 |
| Quadrant | Total seconds | Saturated seconds | Saturation percentage |
|---|---|---|---|
| A | 5899 | 99 | 1.678251% |
| B | 5899 | 103 | 1.746059% |
| C | 5899 | 581 | 9.849127% |
| D | 5899 | 136 | 2.305476% |
Noise dominated data is calculated using 1-second bins in cleaned event files. If a bin has >2000 counts, and if more than 50% of those come from <1% of pixels, then it is considered to be noise-dominated and hence unusable.
| Quadrant | # 1 sec bins | Bins with >0 counts | Bins with >2000 counts | High rate bins dominated by noise | Noise dominated (total time) | Noise dominated (detector-on time) | Marked lightcurve |
|---|---|---|---|---|---|---|---|
| A | 5899 | 5899 | 0 | 0 | 0.00% | 0.00% |  |
| B | 5899 | 5899 | 0 | 0 | 0.00% | 0.00% | 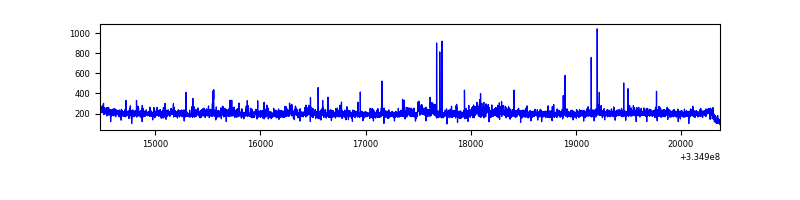 |
| C | 5899 | 5899 | 20 | 20 | 0.34% | 0.34% |  |
| D | 5899 | 5899 | 15 | 15 | 0.25% | 0.25% |  |
Top three noisy pixels from each quadrant. If the there are fewer than three noisy pixels in the level2.evt file, extra rows are filled as -1
| Pixel properties | Quadrant properties | ||||||
|---|---|---|---|---|---|---|---|
| Quadrant | DetID | PixID | Counts | Sigma | Mean | Median | Sigma |
| A | 13 | 254 | 8892 | 129.04 | 295 | 288 | 66.7 |
| A | 12 | 194 | 1827 | 23.08 | 295 | 288 | 66.7 |
| A | 0 | 226 | 1811 | 22.84 | 295 | 288 | 66.7 |
| B | 0 | 230 | 35225 | 582.5 | 298 | 291 | 60.0 |
| B | 0 | 219 | 13186 | 215.01 | 298 | 291 | 60.0 |
| B | 5 | 172 | 4805 | 75.27 | 298 | 291 | 60.0 |
| C | 3 | 233 | 1608960 | 23154.92 | 281 | 278 | 69.5 |
| C | 0 | 239 | 6632 | 91.45 | 281 | 278 | 69.5 |
| C | 4 | 175 | 5933 | 81.39 | 281 | 278 | 69.5 |
| D | 1 | 52 | 1024738 | 14586.25 | 292 | 283 | 70.2 |
| D | 2 | 234 | 26939 | 379.53 | 292 | 283 | 70.2 |
| D | 13 | 168 | 21569 | 303.07 | 292 | 283 | 70.2 |
Histogram calculated using DETX and DETY for each event in the final _common_clean file
| Quadrant A |  |
 |
Quadrant B |
|---|---|---|---|
| Quadrant D |  |
 |
Quadrant C |
| Plot type | Count rate plots | Images |
|---|---|---|
| Comparison with Poisson distribution Blue bars denote a histogram of data divided into 1 sec bins. Red curve is a Poisson curve with rate = median count rate of data. |
 |
 |
| Quadrant-wise count rates Data is divided into 100 sec bins |
 |
|
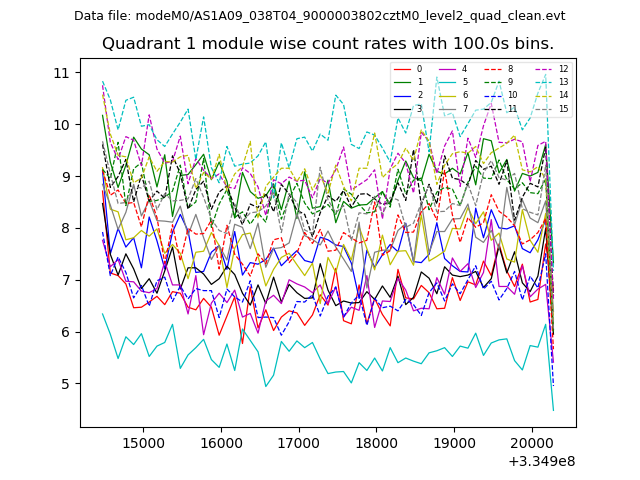
| Module-wise count rates for Quadrant A Data is divided into 100 sec bins |
 |
 |
| Module-wise count rates for Quadrant B Data is divided into 100 sec bins |
 |
 |
| Module-wise count rates for Quadrant C Data is divided into 100 sec bins |
 |
 |
| Module-wise count rates for Quadrant D Data is divided into 100 sec bins |
 |
 |
| Parameter | Plot |
|---|---|
| CZT HV Monitor |  |
| D_VDD | 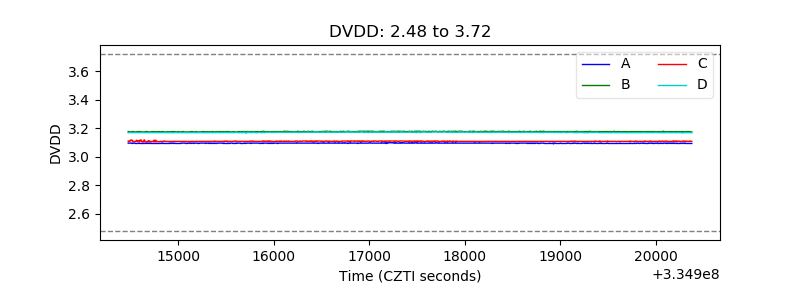 |
| Temperature 1 |  |
| Veto HV Monitor |  |
| Veto LLD |  |
| Alpha Counter | 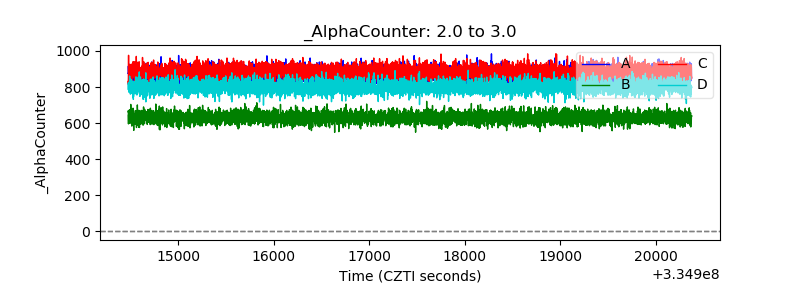 |
| _CPM_Rate | 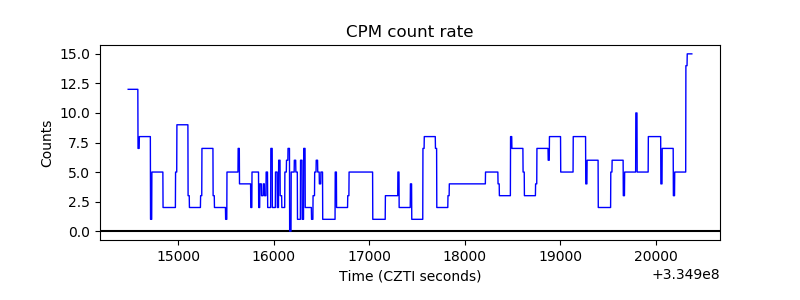 |
| CZT Counter |  |
| +2.5 Volts monitor |  |
| +5 Volts monitor |  |
| _ROLL_ROT |  |
| _Roll_DEC |  |
| _Roll_RA | 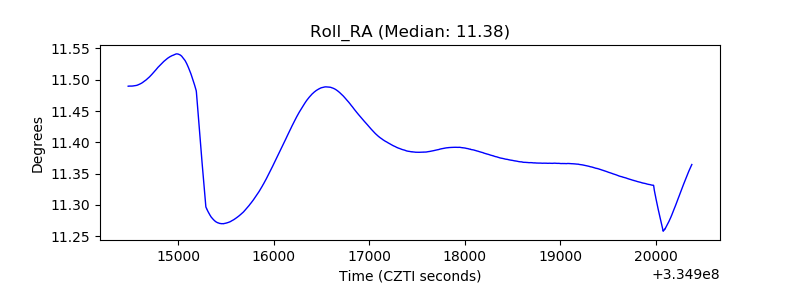 |
| Veto Counter |  |