| Param | Original file | Final file |
|---|---|---|
| Filename | modeM0/AS1A09_038T03_9000003800cztM0_level2_bc.evt | modeM0/AS1A09_038T03_9000003800cztM0_level2_quad_clean.evt |
| Size (bytes) | 268,822,080 | 124,519,680 |
| Size | 256.4 MB | 118.8 MB |
| Events in quadrant A | 1,301,732 | 836,099 |
| Events in quadrant B | 1,365,154 | 853,821 |
| Events in quadrant C | 2,560,552 | 809,057 |
| Events in quadrant D | 2,455,035 | 810,366 |
| Mode SS | |||
|---|---|---|---|
| Quadrant | BADHDUFLAG | Total packets | Discarded packets |
| A | 0 | 136 | 0 |
| B | 0 | 136 | 0 |
| C | 0 | 136 | 0 |
| D | 0 | 136 | 0 |
| Mode M9 | |||
|---|---|---|---|
| Quadrant | BADHDUFLAG | Total packets | Discarded packets |
| A | 0 | 3 | 0 |
| B | 0 | 3 | 0 |
| C | 0 | 3 | 0 |
| D | 0 | 3 | 0 |
| Mode M0 | |||
|---|---|---|---|
| Quadrant | BADHDUFLAG | Total packets | Discarded packets |
| A | 0 | 13590 | 0 |
| B | 0 | 13735 | 0 |
| C | 0 | 18419 | 0 |
| D | 0 | 17011 | 0 |
| Quadrant | Total seconds | Saturated seconds | Saturation percentage |
|---|---|---|---|
| A | 6617 | 178 | 2.690041% |
| B | 6617 | 214 | 3.234094% |
| C | 6617 | 514 | 7.767871% |
| D | 6617 | 265 | 4.004836% |
Noise dominated data is calculated using 1-second bins in cleaned event files. If a bin has >2000 counts, and if more than 50% of those come from <1% of pixels, then it is considered to be noise-dominated and hence unusable.
| Quadrant | # 1 sec bins | Bins with >0 counts | Bins with >2000 counts | High rate bins dominated by noise | Noise dominated (total time) | Noise dominated (detector-on time) | Marked lightcurve |
|---|---|---|---|---|---|---|---|
| A | 6977 | 6617 | 0 | 0 | 0.00% | 0.00% |  |
| B | 6977 | 6617 | 0 | 0 | 0.00% | 0.00% |  |
| C | 6977 | 6617 | 11 | 11 | 0.16% | 0.17% |  |
| D | 6977 | 6616 | 46 | 46 | 0.66% | 0.70% |  |
Top three noisy pixels from each quadrant. If the there are fewer than three noisy pixels in the level2.evt file, extra rows are filled as -1
| Pixel properties | Quadrant properties | ||||||
|---|---|---|---|---|---|---|---|
| Quadrant | DetID | PixID | Counts | Sigma | Mean | Median | Sigma |
| A | 6 | 16 | 11439 | 145.76 | 334 | 327 | 76.2 |
| A | 13 | 254 | 9772 | 123.9 | 334 | 327 | 76.2 |
| A | 0 | 226 | 2098 | 23.23 | 334 | 327 | 76.2 |
| B | 0 | 219 | 40631 | 585.97 | 339 | 330 | 68.8 |
| B | 0 | 230 | 21028 | 300.95 | 339 | 330 | 68.8 |
| B | 15 | 185 | 5916 | 81.22 | 339 | 330 | 68.8 |
| C | 3 | 233 | 1043072 | 13346.45 | 322 | 322 | 78.1 |
| C | 0 | 239 | 265022 | 3387.97 | 322 | 322 | 78.1 |
| C | 2 | 16 | 9201 | 113.64 | 322 | 322 | 78.1 |
| D | 1 | 52 | 1122120 | 14170.16 | 330 | 320 | 79.2 |
| D | 2 | 234 | 30367 | 379.54 | 330 | 320 | 79.2 |
| D | 11 | 176 | 14265 | 176.15 | 330 | 320 | 79.2 |
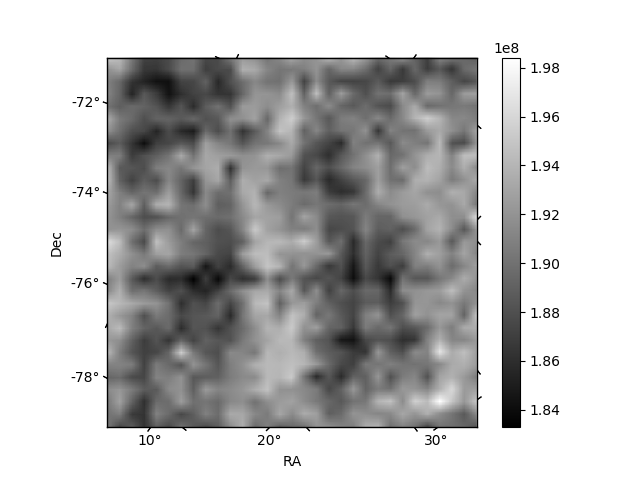
Histogram calculated using DETX and DETY for each event in the final _common_clean file
| Quadrant A | 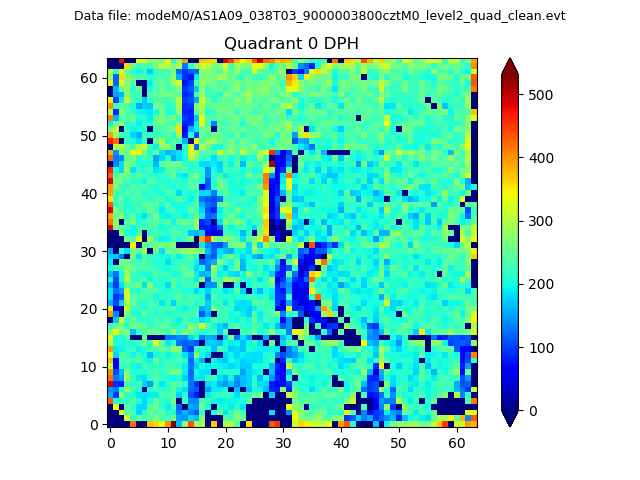 |
 |
Quadrant B |
|---|---|---|---|
| Quadrant D |  |
 |
Quadrant C |
| Plot type | Count rate plots | Images |
|---|---|---|
| Comparison with Poisson distribution Blue bars denote a histogram of data divided into 1 sec bins. Red curve is a Poisson curve with rate = median count rate of data. |
 |
 |
| Quadrant-wise count rates Data is divided into 100 sec bins |
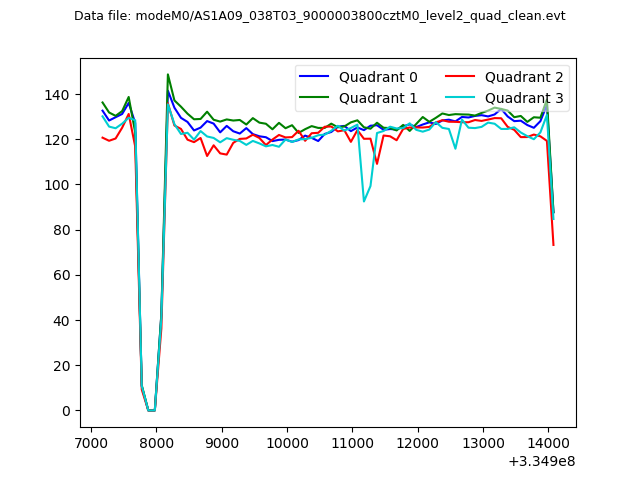 |
|
| Module-wise count rates for Quadrant A Data is divided into 100 sec bins |
 |
 |
| Module-wise count rates for Quadrant B Data is divided into 100 sec bins |
 |
 |
| Module-wise count rates for Quadrant C Data is divided into 100 sec bins |
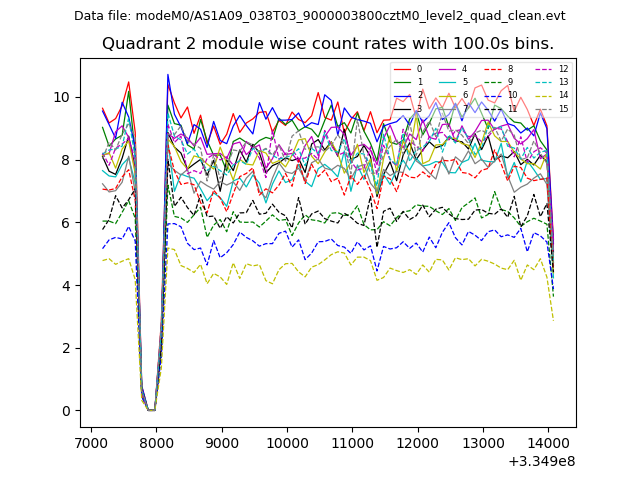 |
 |
| Module-wise count rates for Quadrant D Data is divided into 100 sec bins |
 |
 |
| Parameter | Plot |
|---|---|
| CZT HV Monitor |  |
| D_VDD | 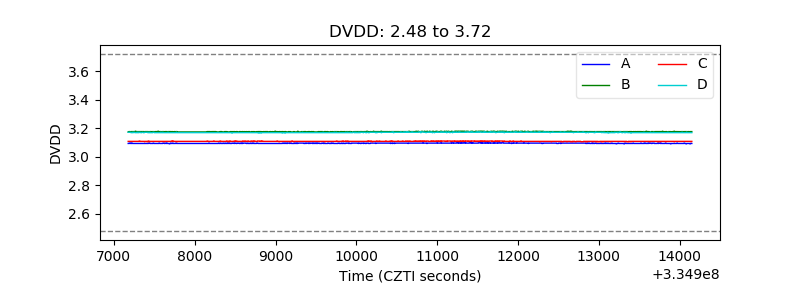 |
| Temperature 1 |  |
| Veto HV Monitor |  |
| Veto LLD | 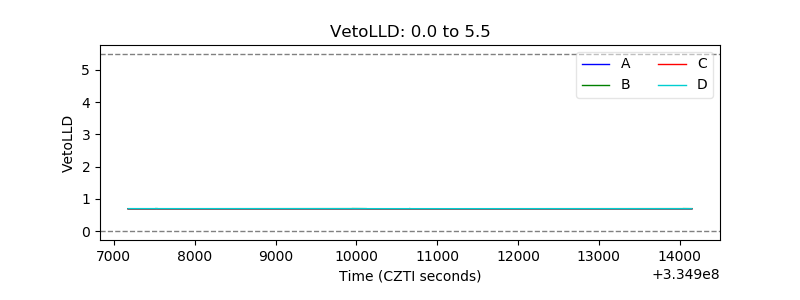 |
| Alpha Counter |  |
| _CPM_Rate |  |
| CZT Counter |  |
| +2.5 Volts monitor |  |
| +5 Volts monitor |  |
| _ROLL_ROT |  |
| _Roll_DEC | 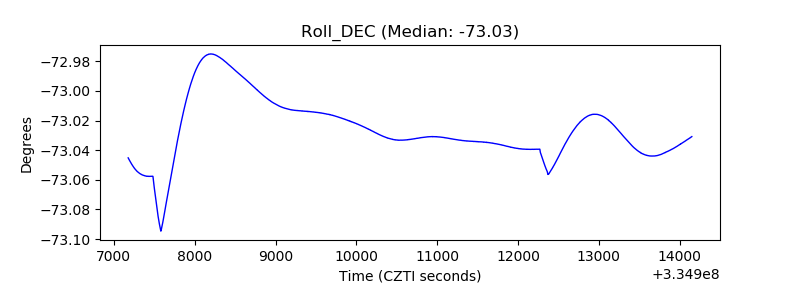 |
| _Roll_RA |  |
| Veto Counter | 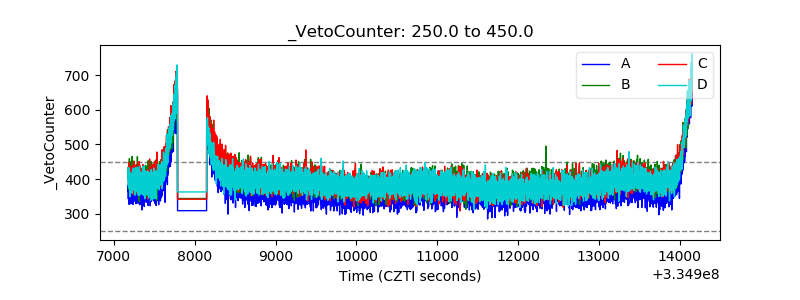 |