| Param | Original file | Final file |
|---|---|---|
| Filename | modeM0/AS1A09_038T02_9000003798cztM0_level2_bc.evt | modeM0/AS1A09_038T02_9000003798cztM0_level2_quad_clean.evt |
| Size (bytes) | 416,160,000 | 205,488,000 |
| Size | 396.9 MB | 196.0 MB |
| Events in quadrant A | 2,306,269 | 1,367,720 |
| Events in quadrant B | 2,362,260 | 1,402,189 |
| Events in quadrant C | 3,934,407 | 1,331,036 |
| Events in quadrant D | 3,227,296 | 1,345,230 |
| Mode M0 | |||
|---|---|---|---|
| Quadrant | BADHDUFLAG | Total packets | Discarded packets |
| A | 0 | 22920 | 0 |
| B | 0 | 23080 | 0 |
| C | 0 | 29675 | 0 |
| D | 0 | 25425 | 0 |
| Mode M9 | |||
|---|---|---|---|
| Quadrant | BADHDUFLAG | Total packets | Discarded packets |
| A | 0 | 18 | 0 |
| B | 0 | 18 | 0 |
| C | 0 | 18 | 0 |
| D | 0 | 18 | 0 |
| Mode SS | |||
|---|---|---|---|
| Quadrant | BADHDUFLAG | Total packets | Discarded packets |
| A | 0 | 228 | 0 |
| B | 0 | 228 | 0 |
| C | 0 | 228 | 0 |
| D | 0 | 228 | 0 |
| Quadrant | Total seconds | Saturated seconds | Saturation percentage |
|---|---|---|---|
| A | 11244 | 67 | 0.595873% |
| B | 11244 | 115 | 1.022768% |
| C | 11244 | 779 | 6.928139% |
| D | 11244 | 161 | 1.431875% |
Noise dominated data is calculated using 1-second bins in cleaned event files. If a bin has >2000 counts, and if more than 50% of those come from <1% of pixels, then it is considered to be noise-dominated and hence unusable.
| Quadrant | # 1 sec bins | Bins with >0 counts | Bins with >2000 counts | High rate bins dominated by noise | Noise dominated (total time) | Noise dominated (detector-on time) | Marked lightcurve |
|---|---|---|---|---|---|---|---|
| A | 13044 | 11246 | 0 | 0 | 0.00% | 0.00% |  |
| B | 13044 | 11244 | 1 | 1 | 0.01% | 0.01% |  |
| C | 13044 | 11245 | 14 | 14 | 0.11% | 0.12% |  |
| D | 13044 | 11245 | 23 | 23 | 0.18% | 0.20% |  |
Top three noisy pixels from each quadrant. If the there are fewer than three noisy pixels in the level2.evt file, extra rows are filled as -1
| Pixel properties | Quadrant properties | ||||||
|---|---|---|---|---|---|---|---|
| Quadrant | DetID | PixID | Counts | Sigma | Mean | Median | Sigma |
| A | 6 | 16 | 24794 | 187.01 | 590 | 578 | 129.5 |
| A | 13 | 254 | 16295 | 121.38 | 590 | 578 | 129.5 |
| A | 0 | 226 | 3777 | 24.7 | 590 | 578 | 129.5 |
| B | 0 | 230 | 25293 | 212.55 | 602 | 589 | 116.2 |
| B | 0 | 219 | 13459 | 110.73 | 602 | 589 | 116.2 |
| B | 3 | 64 | 10988 | 89.47 | 602 | 589 | 116.2 |
| C | 3 | 233 | 1668221 | 12003.47 | 571 | 569 | 138.9 |
| C | 0 | 239 | 45231 | 321.47 | 571 | 569 | 138.9 |
| C | 2 | 16 | 19381 | 135.41 | 571 | 569 | 138.9 |
| D | 1 | 52 | 877716 | 6290.36 | 589 | 573 | 139.4 |
| D | 2 | 234 | 44304 | 313.61 | 589 | 573 | 139.4 |
| D | 11 | 176 | 26613 | 186.74 | 589 | 573 | 139.4 |
Histogram calculated using DETX and DETY for each event in the final _common_clean file
| Quadrant A |  |
 |
Quadrant B |
|---|---|---|---|
| Quadrant D |  |
 |
Quadrant C |
| Plot type | Count rate plots | Images |
|---|---|---|
| Comparison with Poisson distribution Blue bars denote a histogram of data divided into 1 sec bins. Red curve is a Poisson curve with rate = median count rate of data. |
 |
 |
| Quadrant-wise count rates Data is divided into 100 sec bins |
 |
|
| Module-wise count rates for Quadrant A Data is divided into 100 sec bins |
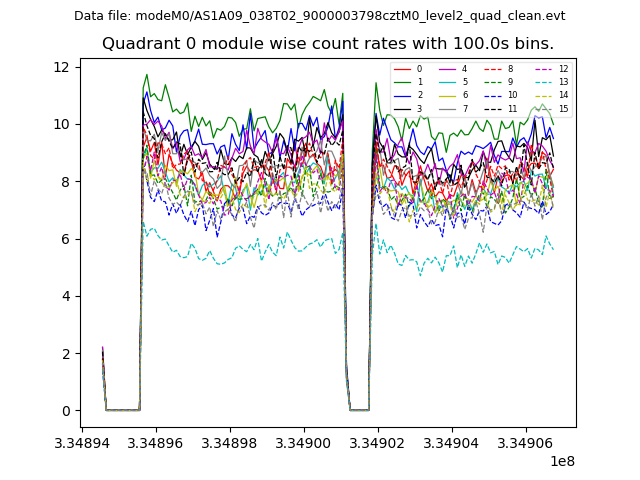 |
 |
| Module-wise count rates for Quadrant B Data is divided into 100 sec bins |
 |
 |
| Module-wise count rates for Quadrant C Data is divided into 100 sec bins |
 |
 |
| Module-wise count rates for Quadrant D Data is divided into 100 sec bins |
 |
 |
| Parameter | Plot |
|---|---|
| CZT HV Monitor |  |
| D_VDD |  |
| Temperature 1 |  |
| Veto HV Monitor |  |
| Veto LLD |  |
| Alpha Counter |  |
| _CPM_Rate |  |
| CZT Counter |  |
| +2.5 Volts monitor |  |
| +5 Volts monitor | 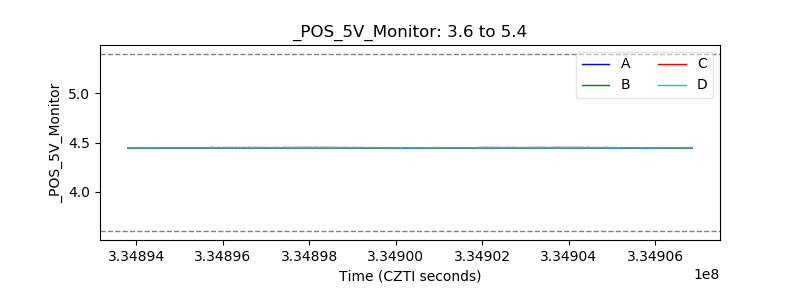 |
| _ROLL_ROT |  |
| _Roll_DEC |  |
| _Roll_RA |  |
| Veto Counter |  |