| Param | Original file | Final file |
|---|---|---|
| Filename | modeM0/AS1A09_008T02_9000003796cztM0_level2_bc.evt | modeM0/AS1A09_008T02_9000003796cztM0_level2_quad_clean.evt |
| Size (bytes) | 8,633,655,360 | 3,080,710,080 |
| Size | 8.0 GB | 2.9 GB |
| Events in quadrant A | 41,480,990 | 20,667,417 |
| Events in quadrant B | 42,896,036 | 21,152,970 |
| Events in quadrant C | 59,297,461 | 20,053,577 |
| Events in quadrant D | 104,487,736 | 18,043,788 |
| Mode SS | |||
|---|---|---|---|
| Quadrant | BADHDUFLAG | Total packets | Discarded packets |
| A | 0 | 3986 | 0 |
| B | 0 | 3986 | 0 |
| C | 0 | 3986 | 0 |
| D | 0 | 3986 | 0 |
| Mode M0 | |||
|---|---|---|---|
| Quadrant | BADHDUFLAG | Total packets | Discarded packets |
| A | 0 | 404528 | 0 |
| B | 0 | 409442 | 0 |
| C | 0 | 480651 | 0 |
| D | 0 | 681660 | 0 |
| Mode M9 | |||
|---|---|---|---|
| Quadrant | BADHDUFLAG | Total packets | Discarded packets |
| A | 0 | 323 | 0 |
| B | 0 | 323 | 0 |
| C | 0 | 323 | 0 |
| D | 0 | 323 | 0 |
| Quadrant | Total seconds | Saturated seconds | Saturation percentage |
|---|---|---|---|
| A | 195495 | 2020 | 1.033275% |
| B | 195494 | 2688 | 1.374978% |
| C | 195492 | 10474 | 5.357764% |
| D | 195493 | 33077 | 16.919787% |
Noise dominated data is calculated using 1-second bins in cleaned event files. If a bin has >2000 counts, and if more than 50% of those come from <1% of pixels, then it is considered to be noise-dominated and hence unusable.
| Quadrant | # 1 sec bins | Bins with >0 counts | Bins with >2000 counts | High rate bins dominated by noise | Noise dominated (total time) | Noise dominated (detector-on time) | Marked lightcurve |
|---|---|---|---|---|---|---|---|
| A | 236776 | 195501 | 0 | 0 | 0.00% | 0.00% |  |
| B | 236776 | 195497 | 38 | 38 | 0.02% | 0.02% | 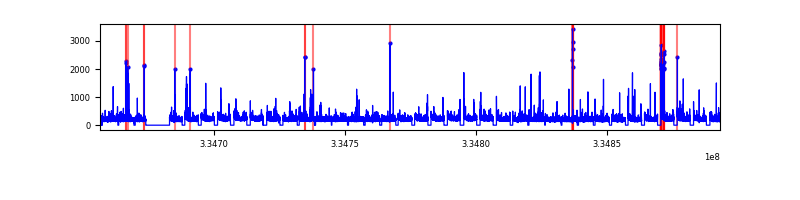 |
| C | 236776 | 195495 | 305 | 305 | 0.13% | 0.16% |  |
| D | 236776 | 195383 | 7010 | 7010 | 2.96% | 3.59% | 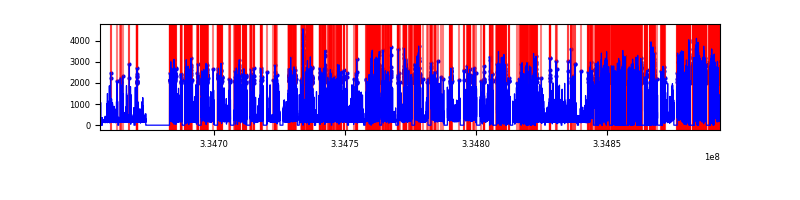 |
Top three noisy pixels from each quadrant. If the there are fewer than three noisy pixels in the level2.evt file, extra rows are filled as -1
| Pixel properties | Quadrant properties | ||||||
|---|---|---|---|---|---|---|---|
| Quadrant | DetID | PixID | Counts | Sigma | Mean | Median | Sigma |
| A | 13 | 254 | 290228 | 123.1 | 10640 | 10483 | 2272.5 |
| A | 6 | 16 | 199701 | 83.26 | 10640 | 10483 | 2272.5 |
| A | 7 | 192 | 110538 | 44.03 | 10640 | 10483 | 2272.5 |
| B | 0 | 230 | 453187 | 221.75 | 10781 | 10558 | 1996.0 |
| B | 3 | 64 | 385639 | 187.91 | 10781 | 10558 | 1996.0 |
| B | 12 | 16 | 265914 | 127.93 | 10781 | 10558 | 1996.0 |
| C | 3 | 233 | 12014567 | 4940.77 | 10236 | 10218 | 2429.6 |
| C | 4 | 254 | 5563640 | 2285.69 | 10236 | 10218 | 2429.6 |
| C | 2 | 16 | 2069259 | 847.46 | 10236 | 10218 | 2429.6 |
| D | 1 | 52 | 60751467 | 27743.05 | 9462 | 9223 | 2189.5 |
| D | 11 | 176 | 2612573 | 1189.04 | 9462 | 9223 | 2189.5 |
| D | 12 | 233 | 2611852 | 1188.71 | 9462 | 9223 | 2189.5 |
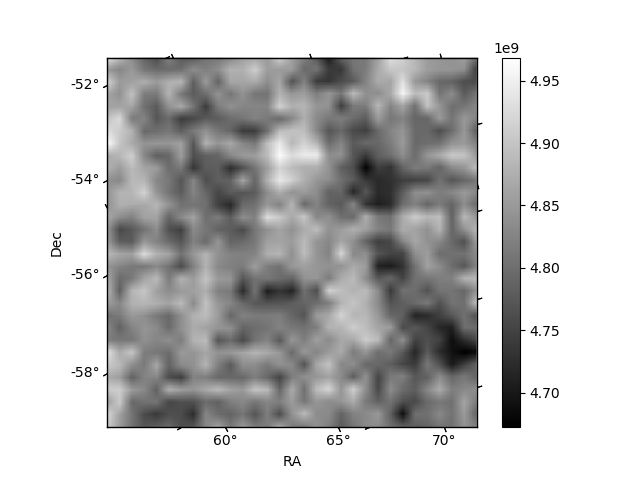
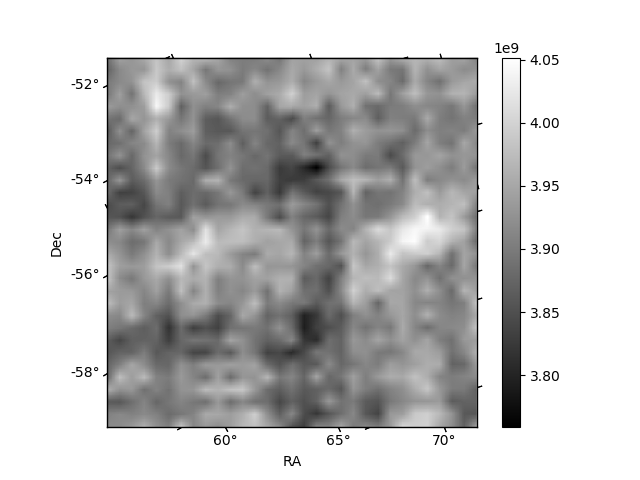
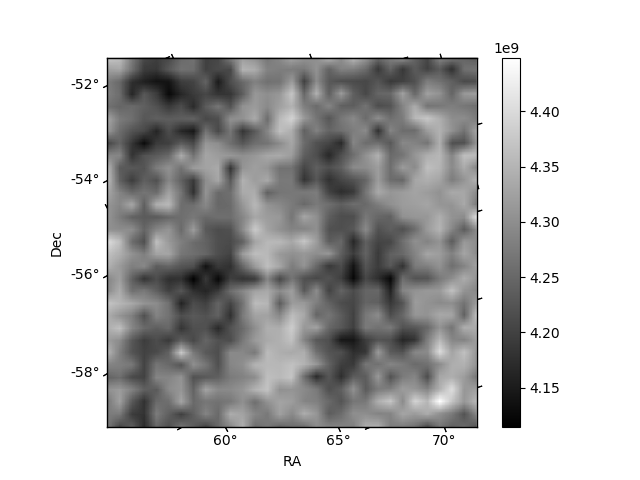
Histogram calculated using DETX and DETY for each event in the final _common_clean file
| Quadrant A |  |
 |
Quadrant B |
|---|---|---|---|
| Quadrant D |  |
 |
Quadrant C |
| Plot type | Count rate plots | Images |
|---|---|---|
| Comparison with Poisson distribution Blue bars denote a histogram of data divided into 1 sec bins. Red curve is a Poisson curve with rate = median count rate of data. |
 |
 |
| Quadrant-wise count rates Data is divided into 100 sec bins |
 |
|
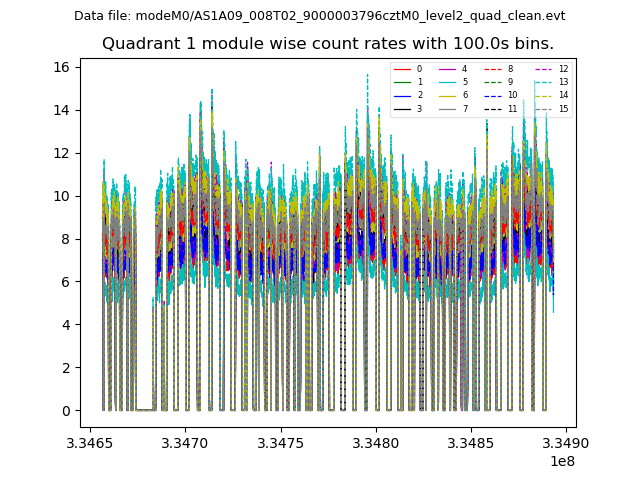
| Module-wise count rates for Quadrant A Data is divided into 100 sec bins |
 |
 |
| Module-wise count rates for Quadrant B Data is divided into 100 sec bins |
 |
 |
| Module-wise count rates for Quadrant C Data is divided into 100 sec bins |
 |
 |
| Module-wise count rates for Quadrant D Data is divided into 100 sec bins |
 |
 |
| Parameter | Plot |
|---|---|
| CZT HV Monitor |  |
| D_VDD | 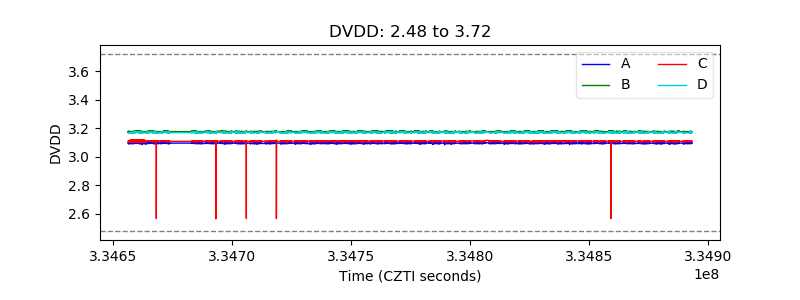 |
| Temperature 1 | 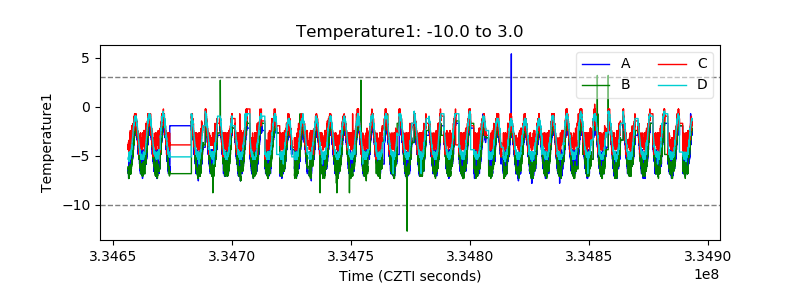 |
| Veto HV Monitor |  |
| Veto LLD |  |
| Alpha Counter |  |
| _CPM_Rate |  |
| CZT Counter |  |
| +2.5 Volts monitor |  |
| +5 Volts monitor |  |
| _ROLL_ROT |  |
| _Roll_DEC |  |
| _Roll_RA | 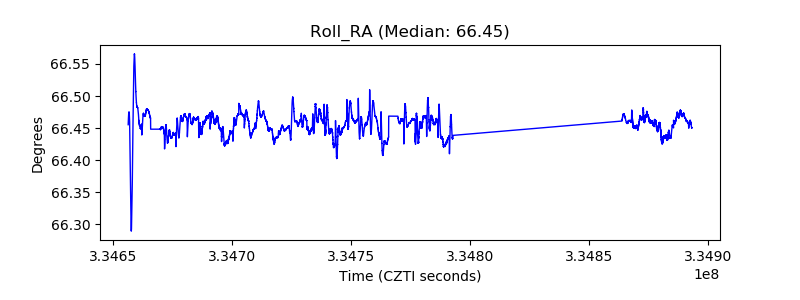 |
| Veto Counter |  |