| Param | Original file | Final file |
|---|---|---|
| Filename | modeM0/AS1A09_143T03_9000003794cztM0_level2_bc.evt | modeM0/AS1A09_143T03_9000003794cztM0_level2_quad_clean.evt |
| Size (bytes) | 1,923,909,120 | 799,980,480 |
| Size | 1.8 GB | 762.9 MB |
| Events in quadrant A | 13,318,991 | 5,112,729 |
| Events in quadrant B | 12,365,371 | 5,288,442 |
| Events in quadrant C | 15,297,597 | 4,999,595 |
| Events in quadrant D | 13,449,649 | 4,974,421 |
| Mode M0 | |||
|---|---|---|---|
| Quadrant | BADHDUFLAG | Total packets | Discarded packets |
| A | 0 | 121542 | 0 |
| B | 0 | 118450 | 0 |
| C | 0 | 132014 | 0 |
| D | 0 | 121693 | 0 |
| Mode SS | |||
|---|---|---|---|
| Quadrant | BADHDUFLAG | Total packets | Discarded packets |
| A | 0 | 1142 | 0 |
| B | 0 | 1142 | 0 |
| C | 0 | 1142 | 0 |
| D | 0 | 1142 | 0 |
| Mode M9 | |||
|---|---|---|---|
| Quadrant | BADHDUFLAG | Total packets | Discarded packets |
| A | 0 | 113 | 0 |
| B | 0 | 113 | 0 |
| C | 0 | 113 | 0 |
| D | 0 | 113 | 0 |
| Quadrant | Total seconds | Saturated seconds | Saturation percentage |
|---|---|---|---|
| A | 56228 | 619 | 1.100875% |
| B | 56229 | 501 | 0.890999% |
| C | 56229 | 1847 | 3.284782% |
| D | 56229 | 660 | 1.173772% |
Noise dominated data is calculated using 1-second bins in cleaned event files. If a bin has >2000 counts, and if more than 50% of those come from <1% of pixels, then it is considered to be noise-dominated and hence unusable.
| Quadrant | # 1 sec bins | Bins with >0 counts | Bins with >2000 counts | High rate bins dominated by noise | Noise dominated (total time) | Noise dominated (detector-on time) | Marked lightcurve |
|---|---|---|---|---|---|---|---|
| A | 70445 | 56232 | 38 | 38 | 0.05% | 0.07% |  |
| B | 70445 | 56232 | 1 | 1 | 0.00% | 0.00% |  |
| C | 70445 | 56232 | 33 | 33 | 0.05% | 0.06% |  |
| D | 70445 | 56230 | 31 | 31 | 0.04% | 0.06% |  |
Top three noisy pixels from each quadrant. If the there are fewer than three noisy pixels in the level2.evt file, extra rows are filled as -1
| Pixel properties | Quadrant properties | ||||||
|---|---|---|---|---|---|---|---|
| Quadrant | DetID | PixID | Counts | Sigma | Mean | Median | Sigma |
| A | 0 | 13 | 1332012 | 2014.6 | 3098 | 3048 | 659.7 |
| A | 13 | 254 | 89053 | 130.38 | 3098 | 3048 | 659.7 |
| A | 0 | 226 | 19957 | 25.63 | 3098 | 3048 | 659.7 |
| B | 0 | 230 | 187056 | 312.44 | 3165 | 3095 | 588.8 |
| B | 8 | 61 | 20440 | 29.46 | 3165 | 3095 | 588.8 |
| B | 0 | 219 | 17653 | 24.73 | 3165 | 3095 | 588.8 |
| C | 4 | 254 | 2977567 | 4190.23 | 3017 | 3007 | 709.9 |
| C | 3 | 233 | 517640 | 724.96 | 3017 | 3007 | 709.9 |
| C | 2 | 16 | 227107 | 315.69 | 3017 | 3007 | 709.9 |
| D | 12 | 233 | 595286 | 846.06 | 3070 | 2985 | 700.1 |
| D | 1 | 52 | 288776 | 408.23 | 3070 | 2985 | 700.1 |
| D | 11 | 176 | 273076 | 385.81 | 3070 | 2985 | 700.1 |
Histogram calculated using DETX and DETY for each event in the final _common_clean file
| Quadrant A |  |
 |
Quadrant B |
|---|---|---|---|
| Quadrant D |  |
 |
Quadrant C |
| Plot type | Count rate plots | Images |
|---|---|---|
| Comparison with Poisson distribution Blue bars denote a histogram of data divided into 1 sec bins. Red curve is a Poisson curve with rate = median count rate of data. |
 |
 |
| Quadrant-wise count rates Data is divided into 100 sec bins |
 |
|
| Module-wise count rates for Quadrant A Data is divided into 100 sec bins |
 |
 |
| Module-wise count rates for Quadrant B Data is divided into 100 sec bins |
 |
 |
| Module-wise count rates for Quadrant C Data is divided into 100 sec bins |
 |
 |
| Module-wise count rates for Quadrant D Data is divided into 100 sec bins |
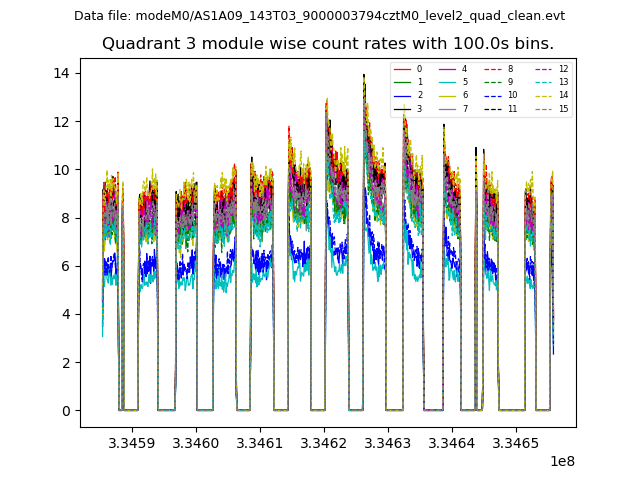 |
 |
| Parameter | Plot |
|---|---|
| CZT HV Monitor |  |
| D_VDD |  |
| Temperature 1 |  |
| Veto HV Monitor |  |
| Veto LLD |  |
| Alpha Counter |  |
| _CPM_Rate |  |
| CZT Counter |  |
| +2.5 Volts monitor | 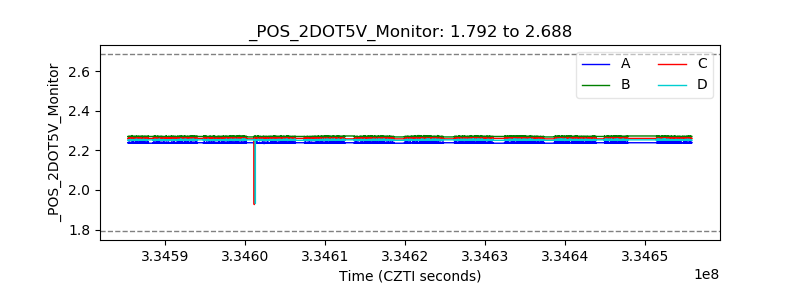 |
| +5 Volts monitor |  |
| _ROLL_ROT | 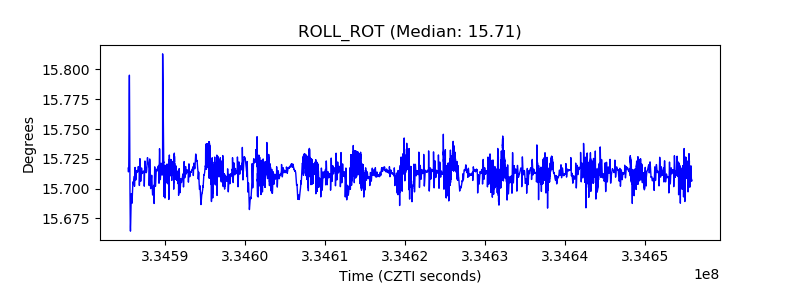 |
| _Roll_DEC |  |
| _Roll_RA |  |
| Veto Counter |  |