| Param | Original file | Final file |
|---|---|---|
| Filename | modeM0/AS1A09_044T01_9000003792cztM0_level2_bc.evt | modeM0/AS1A09_044T01_9000003792cztM0_level2_quad_clean.evt |
| Size (bytes) | 1,751,374,080 | 520,223,040 |
| Size | 1.6 GB | 496.1 MB |
| Events in quadrant A | 9,967,506 | 3,323,418 |
| Events in quadrant B | 8,701,249 | 3,431,088 |
| Events in quadrant C | 10,208,762 | 3,311,033 |
| Events in quadrant D | 21,439,356 | 2,948,913 |
| Mode M0 | |||
|---|---|---|---|
| Quadrant | BADHDUFLAG | Total packets | Discarded packets |
| A | 0 | 87517 | 0 |
| B | 0 | 83032 | 0 |
| C | 0 | 90680 | 0 |
| D | 0 | 135261 | 0 |
| Mode SS | |||
|---|---|---|---|
| Quadrant | BADHDUFLAG | Total packets | Discarded packets |
| A | 0 | 812 | 0 |
| B | 0 | 812 | 0 |
| C | 0 | 812 | 0 |
| D | 0 | 812 | 0 |
| Mode M9 | |||
|---|---|---|---|
| Quadrant | BADHDUFLAG | Total packets | Discarded packets |
| A | 0 | 57 | 0 |
| B | 0 | 57 | 0 |
| C | 0 | 57 | 0 |
| D | 0 | 57 | 0 |
| Quadrant | Total seconds | Saturated seconds | Saturation percentage |
|---|---|---|---|
| A | 39923 | 745 | 1.866092% |
| B | 39922 | 596 | 1.492911% |
| C | 39923 | 1619 | 4.055306% |
| D | 39923 | 5667 | 14.194825% |
Noise dominated data is calculated using 1-second bins in cleaned event files. If a bin has >2000 counts, and if more than 50% of those come from <1% of pixels, then it is considered to be noise-dominated and hence unusable.
| Quadrant | # 1 sec bins | Bins with >0 counts | Bins with >2000 counts | High rate bins dominated by noise | Noise dominated (total time) | Noise dominated (detector-on time) | Marked lightcurve |
|---|---|---|---|---|---|---|---|
| A | 45609 | 39924 | 25 | 25 | 0.05% | 0.06% |  |
| B | 45609 | 39924 | 1 | 1 | 0.00% | 0.00% |  |
| C | 45609 | 39924 | 19 | 19 | 0.04% | 0.05% |  |
| D | 45609 | 39923 | 1069 | 1069 | 2.34% | 2.68% |  |
Top three noisy pixels from each quadrant. If the there are fewer than three noisy pixels in the level2.evt file, extra rows are filled as -1
| Pixel properties | Quadrant properties | ||||||
|---|---|---|---|---|---|---|---|
| Quadrant | DetID | PixID | Counts | Sigma | Mean | Median | Sigma |
| A | 0 | 13 | 1531345 | 3267.3 | 2178 | 2139 | 468.0 |
| A | 13 | 254 | 65555 | 135.49 | 2178 | 2139 | 468.0 |
| A | 8 | 192 | 14905 | 27.27 | 2178 | 2139 | 468.0 |
| B | 0 | 230 | 111069 | 261.65 | 2230 | 2180 | 416.2 |
| B | 8 | 61 | 14444 | 29.47 | 2230 | 2180 | 416.2 |
| B | 3 | 64 | 11893 | 23.34 | 2230 | 2180 | 416.2 |
| C | 4 | 254 | 1744242 | 3487.5 | 2123 | 2117 | 499.5 |
| C | 3 | 233 | 242743 | 481.7 | 2123 | 2117 | 499.5 |
| C | 2 | 16 | 27819 | 51.45 | 2123 | 2117 | 499.5 |
| D | 1 | 52 | 11555857 | 25006.9 | 2009 | 1955 | 462.0 |
| D | 12 | 233 | 1455768 | 3146.59 | 2009 | 1955 | 462.0 |
| D | 13 | 168 | 192482 | 412.37 | 2009 | 1955 | 462.0 |
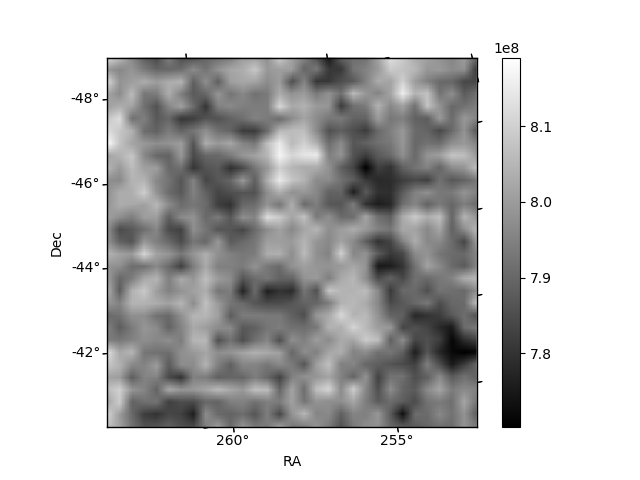
Histogram calculated using DETX and DETY for each event in the final _common_clean file
| Quadrant A |  |
 |
Quadrant B |
|---|---|---|---|
| Quadrant D |  |
 |
Quadrant C |
| Plot type | Count rate plots | Images |
|---|---|---|
| Comparison with Poisson distribution Blue bars denote a histogram of data divided into 1 sec bins. Red curve is a Poisson curve with rate = median count rate of data. |
 |
 |
| Quadrant-wise count rates Data is divided into 100 sec bins |
 |
|
| Module-wise count rates for Quadrant A Data is divided into 100 sec bins |
 |
 |
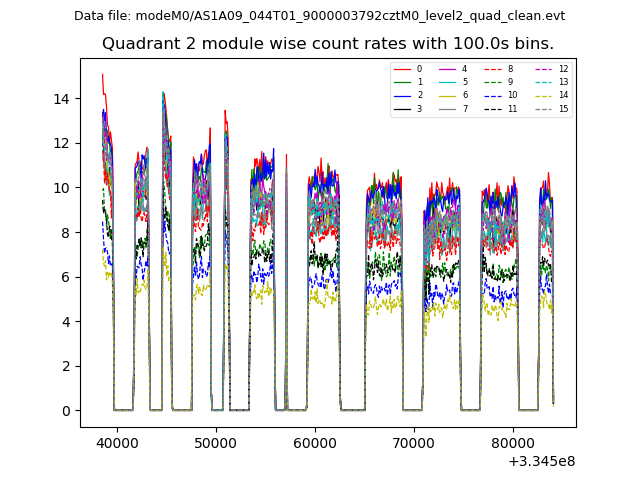
| Module-wise count rates for Quadrant B Data is divided into 100 sec bins |
 |
 |
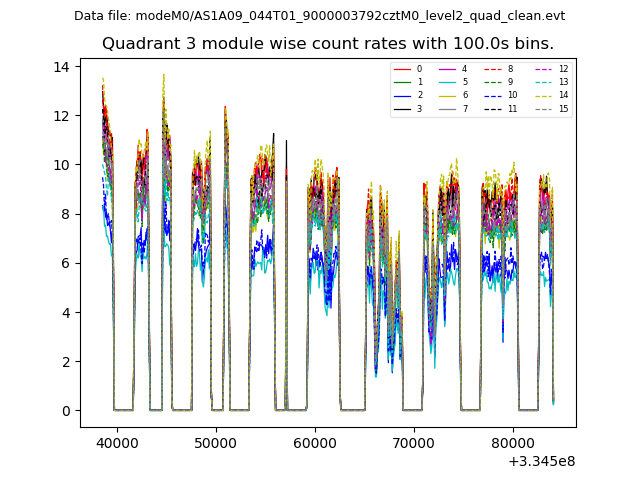
| Module-wise count rates for Quadrant C Data is divided into 100 sec bins |
 |
 |
| Module-wise count rates for Quadrant D Data is divided into 100 sec bins |
 |
 |
| Parameter | Plot |
|---|---|
| CZT HV Monitor |  |
| D_VDD |  |
| Temperature 1 |  |
| Veto HV Monitor |  |
| Veto LLD |  |
| Alpha Counter |  |
| _CPM_Rate | 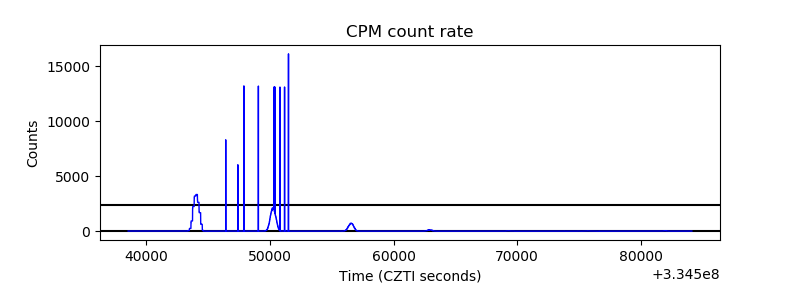 |
| CZT Counter |  |
| +2.5 Volts monitor | 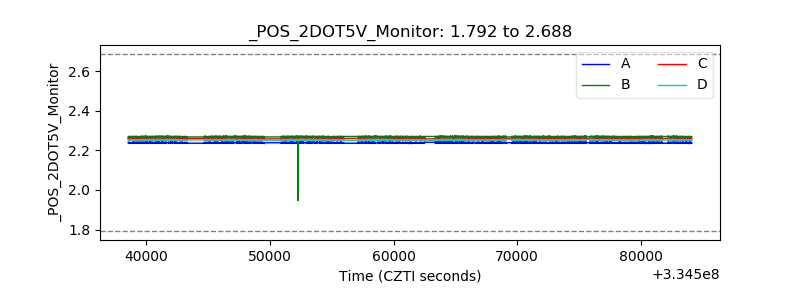 |
| +5 Volts monitor |  |
| _ROLL_ROT |  |
| _Roll_DEC |  |
| _Roll_RA |  |
| Veto Counter |  |