| Param | Original file | Final file |
|---|---|---|
| Filename | modeM0/AS1A09_079T03_9000003790cztM0_level2_bc.evt | modeM0/AS1A09_079T03_9000003790cztM0_level2_quad_clean.evt |
| Size (bytes) | 10,814,808,960 | 4,029,984,000 |
| Size | 10.1 GB | 3.8 GB |
| Events in quadrant A | 69,798,074 | 25,550,400 |
| Events in quadrant B | 65,310,176 | 26,408,157 |
| Events in quadrant C | 78,067,986 | 25,456,079 |
| Events in quadrant D | 94,557,522 | 24,737,910 |
| Mode SS | |||
|---|---|---|---|
| Quadrant | BADHDUFLAG | Total packets | Discarded packets |
| A | 0 | 5912 | 0 |
| B | 0 | 5910 | 0 |
| C | 0 | 5912 | 0 |
| D | 0 | 5912 | 0 |
| Mode M0 | |||
|---|---|---|---|
| Quadrant | BADHDUFLAG | Total packets | Discarded packets |
| A | 0 | 633536 | 0 |
| B | 0 | 619116 | 0 |
| C | 0 | 680553 | 0 |
| D | 0 | 719964 | 0 |
| Mode M9 | |||
|---|---|---|---|
| Quadrant | BADHDUFLAG | Total packets | Discarded packets |
| A | 0 | 467 | 0 |
| B | 0 | 467 | 0 |
| C | 0 | 467 | 0 |
| D | 0 | 467 | 0 |
| Quadrant | Total seconds | Saturated seconds | Saturation percentage |
|---|---|---|---|
| A | 290858 | 5055 | 1.737961% |
| B | 290854 | 4702 | 1.616619% |
| C | 290859 | 11965 | 4.113677% |
| D | 290853 | 10977 | 3.774071% |
Noise dominated data is calculated using 1-second bins in cleaned event files. If a bin has >2000 counts, and if more than 50% of those come from <1% of pixels, then it is considered to be noise-dominated and hence unusable.
| Quadrant | # 1 sec bins | Bins with >0 counts | Bins with >2000 counts | High rate bins dominated by noise | Noise dominated (total time) | Noise dominated (detector-on time) | Marked lightcurve |
|---|---|---|---|---|---|---|---|
| A | 336917 | 290871 | 188 | 188 | 0.06% | 0.06% |  |
| B | 336917 | 290865 | 37 | 37 | 0.01% | 0.01% |  |
| C | 336917 | 290876 | 259 | 259 | 0.08% | 0.09% |  |
| D | 336917 | 290866 | 2021 | 2021 | 0.60% | 0.69% |  |
Top three noisy pixels from each quadrant. If the there are fewer than three noisy pixels in the level2.evt file, extra rows are filled as -1
| Pixel properties | Quadrant properties | ||||||
|---|---|---|---|---|---|---|---|
| Quadrant | DetID | PixID | Counts | Sigma | Mean | Median | Sigma |
| A | 0 | 13 | 9524194 | 2834.43 | 15524 | 15259 | 3354.8 |
| A | 13 | 254 | 459103 | 132.3 | 15524 | 15259 | 3354.8 |
| A | 6 | 16 | 157599 | 42.43 | 15524 | 15259 | 3354.8 |
| B | 5 | 172 | 2085253 | 699.42 | 15853 | 15467 | 2959.3 |
| B | 0 | 230 | 566615 | 186.24 | 15853 | 15467 | 2959.3 |
| B | 7 | 219 | 531761 | 174.47 | 15853 | 15467 | 2959.3 |
| C | 4 | 254 | 7687907 | 2141.91 | 15101 | 15042 | 3582.3 |
| C | 3 | 233 | 6431566 | 1791.2 | 15101 | 15042 | 3582.3 |
| C | 2 | 16 | 5413617 | 1507.03 | 15101 | 15042 | 3582.3 |
| D | 1 | 52 | 29967692 | 8560.22 | 15148 | 14716 | 3499.1 |
| D | 12 | 233 | 2533082 | 719.72 | 15148 | 14716 | 3499.1 |
| D | 2 | 234 | 1255464 | 354.59 | 15148 | 14716 | 3499.1 |
Histogram calculated using DETX and DETY for each event in the final _common_clean file
| Quadrant A |  |
 |
Quadrant B |
|---|---|---|---|
| Quadrant D |  |
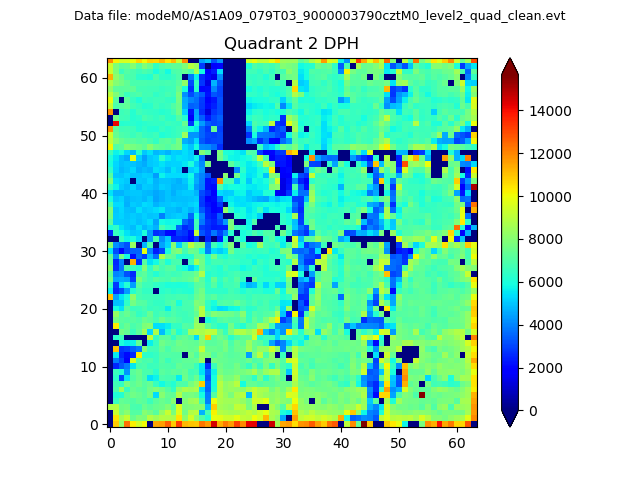 |
Quadrant C |
| Plot type | Count rate plots | Images |
|---|---|---|
| Comparison with Poisson distribution Blue bars denote a histogram of data divided into 1 sec bins. Red curve is a Poisson curve with rate = median count rate of data. |
 |
 |
| Quadrant-wise count rates Data is divided into 100 sec bins |
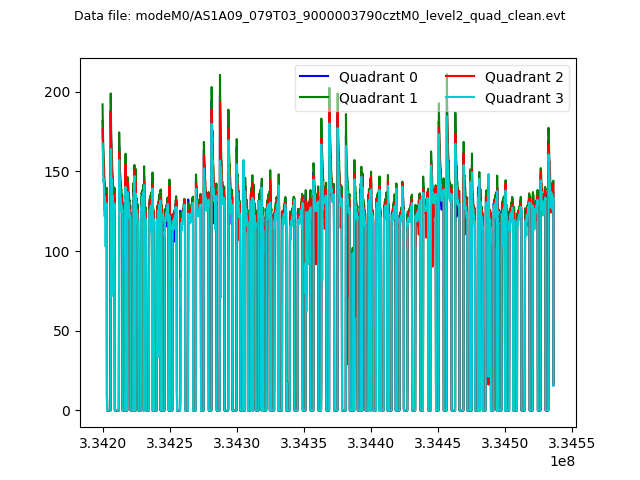 |
|
| Module-wise count rates for Quadrant A Data is divided into 100 sec bins |
 |
 |
| Module-wise count rates for Quadrant B Data is divided into 100 sec bins |
 |
 |
| Module-wise count rates for Quadrant C Data is divided into 100 sec bins |
 |
 |
| Module-wise count rates for Quadrant D Data is divided into 100 sec bins |
 |
 |
| Parameter | Plot |
|---|---|
| CZT HV Monitor | 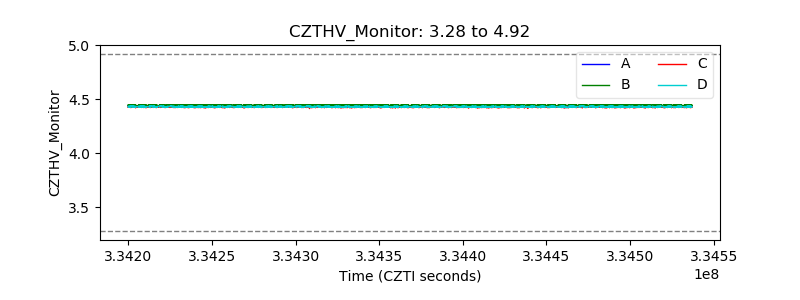 |
| D_VDD |  |
| Temperature 1 |  |
| Veto HV Monitor |  |
| Veto LLD |  |
| Alpha Counter |  |
| _CPM_Rate |  |
| CZT Counter |  |
| +2.5 Volts monitor |  |
| +5 Volts monitor |  |
| _ROLL_ROT |  |
| _Roll_DEC |  |
| _Roll_RA | 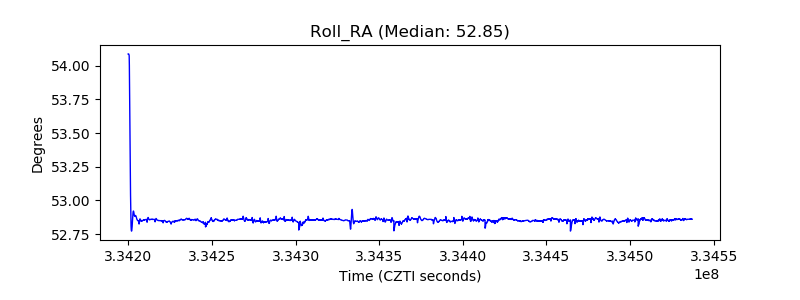 |
| Veto Counter | 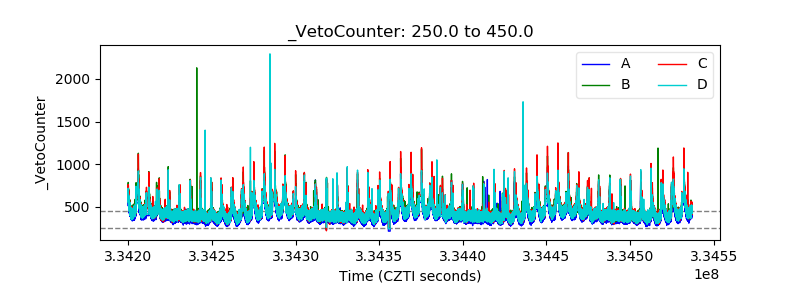 |