| Param | Original file | Final file |
|---|---|---|
| Filename | modeM0/AS1C05_019T04_9000003788cztM0_level2_bc.evt | modeM0/AS1C05_019T04_9000003788cztM0_level2_quad_clean.evt |
| Size (bytes) | 4,077,368,640 | 2,140,784,640 |
| Size | 3.8 GB | 2.0 GB |
| Events in quadrant A | 26,257,090 | 14,575,301 |
| Events in quadrant B | 24,431,953 | 14,809,349 |
| Events in quadrant C | 24,588,610 | 14,184,089 |
| Events in quadrant D | 40,669,176 | 13,697,709 |
| Mode SS | |||
|---|---|---|---|
| Quadrant | BADHDUFLAG | Total packets | Discarded packets |
| A | 0 | 2252 | 0 |
| B | 0 | 2252 | 0 |
| C | 0 | 2252 | 0 |
| D | 0 | 2252 | 0 |
| Mode M9 | |||
|---|---|---|---|
| Quadrant | BADHDUFLAG | Total packets | Discarded packets |
| A | 0 | 180 | 0 |
| B | 0 | 180 | 0 |
| C | 0 | 180 | 0 |
| D | 0 | 180 | 0 |
| Mode M0 | |||
|---|---|---|---|
| Quadrant | BADHDUFLAG | Total packets | Discarded packets |
| A | 0 | 238928 | 0 |
| B | 0 | 233633 | 0 |
| C | 0 | 235469 | 0 |
| D | 0 | 290413 | 0 |
| Quadrant | Total seconds | Saturated seconds | Saturation percentage |
|---|---|---|---|
| A | 110674 | 1684 | 1.521586% |
| B | 110674 | 1624 | 1.467373% |
| C | 110674 | 1883 | 1.701393% |
| D | 110674 | 5897 | 5.328261% |
Noise dominated data is calculated using 1-second bins in cleaned event files. If a bin has >2000 counts, and if more than 50% of those come from <1% of pixels, then it is considered to be noise-dominated and hence unusable.
| Quadrant | # 1 sec bins | Bins with >0 counts | Bins with >2000 counts | High rate bins dominated by noise | Noise dominated (total time) | Noise dominated (detector-on time) | Marked lightcurve |
|---|---|---|---|---|---|---|---|
| A | 127734 | 110679 | 53 | 53 | 0.04% | 0.05% |  |
| B | 127734 | 110676 | 16 | 16 | 0.01% | 0.01% |  |
| C | 127734 | 110676 | 6 | 6 | 0.00% | 0.01% |  |
| D | 127734 | 110679 | 1089 | 1089 | 0.85% | 0.98% | 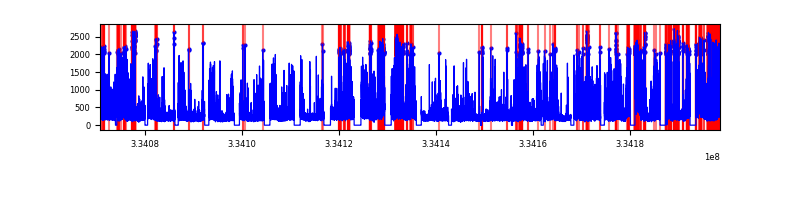 |
Top three noisy pixels from each quadrant. If the there are fewer than three noisy pixels in the level2.evt file, extra rows are filled as -1
| Pixel properties | Quadrant properties | ||||||
|---|---|---|---|---|---|---|---|
| Quadrant | DetID | PixID | Counts | Sigma | Mean | Median | Sigma |
| A | 0 | 13 | 3563122 | 2761.1 | 5871 | 5778 | 1288.4 |
| A | 13 | 254 | 170900 | 128.16 | 5871 | 5778 | 1288.4 |
| A | 4 | 2 | 48809 | 33.4 | 5871 | 5778 | 1288.4 |
| B | 5 | 172 | 1030945 | 916.26 | 5920 | 5786 | 1118.9 |
| B | 0 | 190 | 425528 | 375.15 | 5920 | 5786 | 1118.9 |
| B | 0 | 230 | 202950 | 176.22 | 5920 | 5786 | 1118.9 |
| C | 3 | 233 | 2413113 | 1788.84 | 5654 | 5637 | 1345.8 |
| C | 2 | 16 | 265201 | 192.87 | 5654 | 5637 | 1345.8 |
| C | 0 | 239 | 93386 | 65.2 | 5654 | 5637 | 1345.8 |
| D | 1 | 52 | 15343961 | 11549.61 | 5636 | 5484 | 1328.1 |
| D | 12 | 233 | 1019140 | 763.27 | 5636 | 5484 | 1328.1 |
| D | 7 | 38 | 765366 | 572.18 | 5636 | 5484 | 1328.1 |
Histogram calculated using DETX and DETY for each event in the final _common_clean file
| Quadrant A |  |
 |
Quadrant B |
|---|---|---|---|
| Quadrant D |  |
 |
Quadrant C |
| Plot type | Count rate plots | Images |
|---|---|---|
| Comparison with Poisson distribution Blue bars denote a histogram of data divided into 1 sec bins. Red curve is a Poisson curve with rate = median count rate of data. |
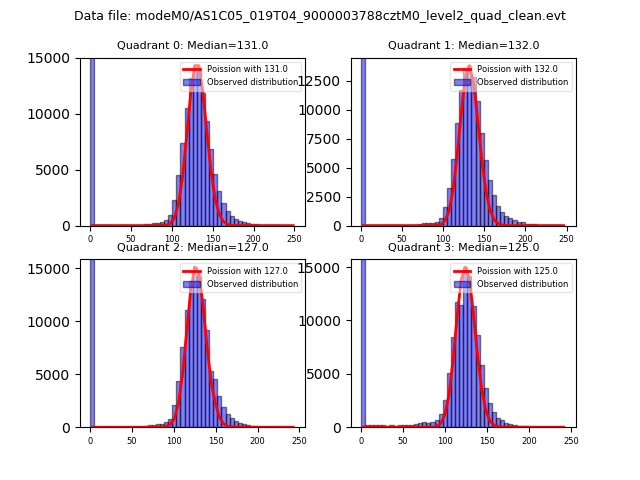 |
 |
| Quadrant-wise count rates Data is divided into 100 sec bins |
 |
|
| Module-wise count rates for Quadrant A Data is divided into 100 sec bins |
 |
 |
| Module-wise count rates for Quadrant B Data is divided into 100 sec bins |
 |
 |
| Module-wise count rates for Quadrant C Data is divided into 100 sec bins |
 |
 |
| Module-wise count rates for Quadrant D Data is divided into 100 sec bins |
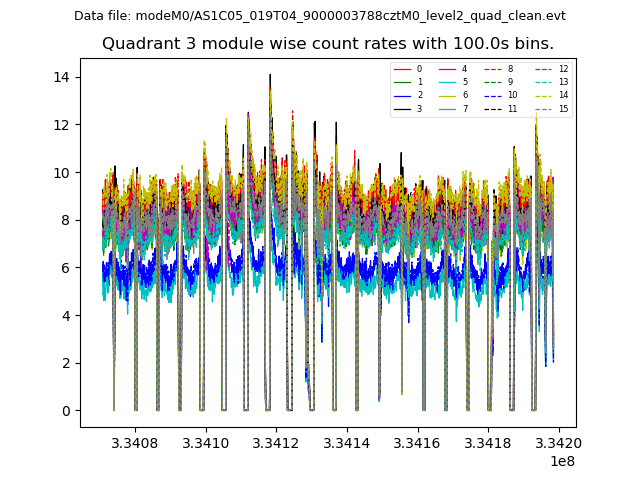 |
 |
| Parameter | Plot |
|---|---|
| CZT HV Monitor |  |
| D_VDD | 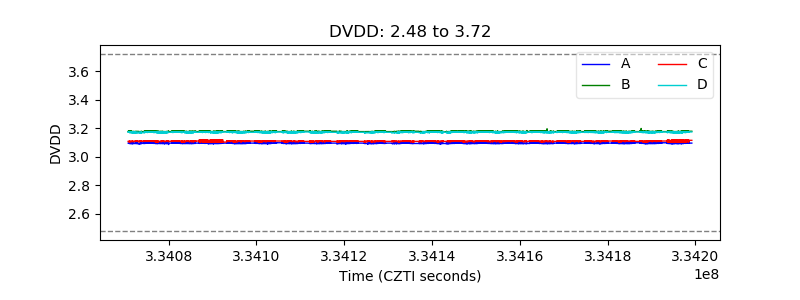 |
| Temperature 1 |  |
| Veto HV Monitor |  |
| Veto LLD |  |
| Alpha Counter |  |
| _CPM_Rate |  |
| CZT Counter |  |
| +2.5 Volts monitor | 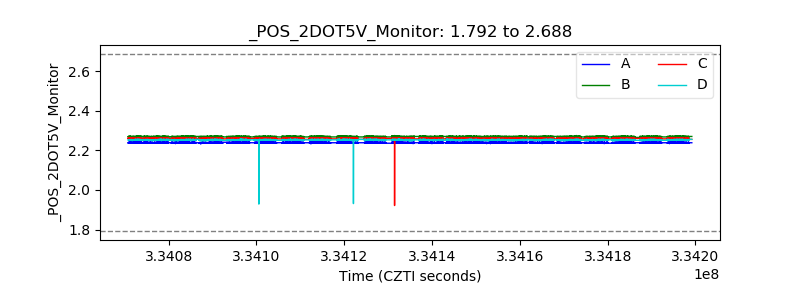 |
| +5 Volts monitor |  |
| _ROLL_ROT |  |
| _Roll_DEC |  |
| _Roll_RA | 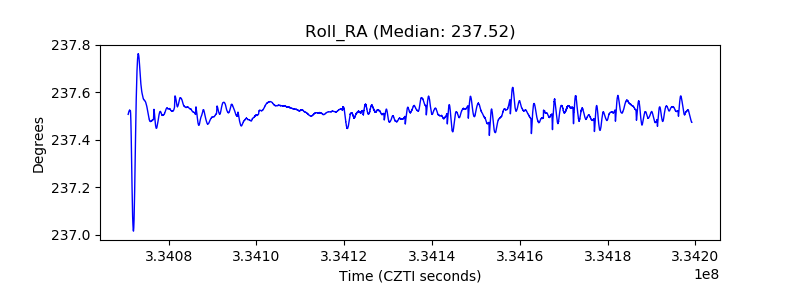 |
| Veto Counter | 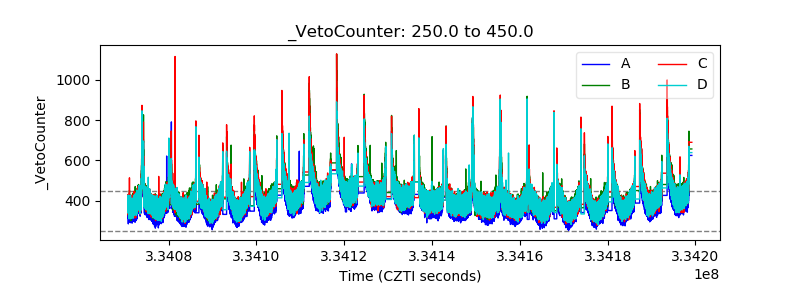 |