| Param | Original file | Final file |
|---|---|---|
| Filename | modeM0/AS1C05_007T01_9000003786cztM0_level2_bc.evt | modeM0/AS1C05_007T01_9000003786cztM0_level2_quad_clean.evt |
| Size (bytes) | 2,571,598,080 | 893,355,840 |
| Size | 2.4 GB | 852.0 MB |
| Events in quadrant A | 15,807,723 | 5,773,215 |
| Events in quadrant B | 15,752,099 | 5,802,284 |
| Events in quadrant C | 16,173,041 | 5,472,103 |
| Events in quadrant D | 25,524,155 | 5,356,730 |
| Mode M0 | |||
|---|---|---|---|
| Quadrant | BADHDUFLAG | Total packets | Discarded packets |
| A | 0 | 145533 | 0 |
| B | 0 | 146001 | 0 |
| C | 0 | 150041 | 0 |
| D | 0 | 179475 | 0 |
| Mode SS | |||
|---|---|---|---|
| Quadrant | BADHDUFLAG | Total packets | Discarded packets |
| A | 0 | 1382 | 0 |
| B | 0 | 1382 | 0 |
| C | 0 | 1382 | 0 |
| D | 0 | 1382 | 0 |
| Mode M9 | |||
|---|---|---|---|
| Quadrant | BADHDUFLAG | Total packets | Discarded packets |
| A | 0 | 118 | 0 |
| B | 0 | 118 | 0 |
| C | 0 | 118 | 0 |
| D | 0 | 118 | 0 |
| Quadrant | Total seconds | Saturated seconds | Saturation percentage |
|---|---|---|---|
| A | 67883 | 946 | 1.393574% |
| B | 67883 | 1159 | 1.707349% |
| C | 67883 | 1554 | 2.289233% |
| D | 67883 | 2211 | 3.257075% |
Noise dominated data is calculated using 1-second bins in cleaned event files. If a bin has >2000 counts, and if more than 50% of those come from <1% of pixels, then it is considered to be noise-dominated and hence unusable.
| Quadrant | # 1 sec bins | Bins with >0 counts | Bins with >2000 counts | High rate bins dominated by noise | Noise dominated (total time) | Noise dominated (detector-on time) | Marked lightcurve |
|---|---|---|---|---|---|---|---|
| A | 79643 | 67888 | 2 | 2 | 0.00% | 0.00% |  |
| B | 79643 | 67885 | 17 | 17 | 0.02% | 0.03% |  |
| C | 79643 | 67883 | 13 | 13 | 0.02% | 0.02% |  |
| D | 79643 | 67884 | 303 | 303 | 0.38% | 0.45% |  |
Top three noisy pixels from each quadrant. If the there are fewer than three noisy pixels in the level2.evt file, extra rows are filled as -1
| Pixel properties | Quadrant properties | ||||||
|---|---|---|---|---|---|---|---|
| Quadrant | DetID | PixID | Counts | Sigma | Mean | Median | Sigma |
| A | 0 | 13 | 797355 | 949.23 | 3891 | 3833 | 836.0 |
| A | 13 | 254 | 102363 | 117.86 | 3891 | 3833 | 836.0 |
| A | 0 | 226 | 24963 | 25.28 | 3891 | 3833 | 836.0 |
| B | 5 | 172 | 409781 | 557.8 | 3902 | 3810 | 727.8 |
| B | 0 | 190 | 317575 | 431.11 | 3902 | 3810 | 727.8 |
| B | 0 | 230 | 50843 | 64.62 | 3902 | 3810 | 727.8 |
| C | 3 | 233 | 1109992 | 1288.27 | 3675 | 3656 | 858.8 |
| C | 2 | 16 | 932812 | 1081.95 | 3675 | 3656 | 858.8 |
| C | 13 | 61 | 21411 | 20.67 | 3675 | 3656 | 858.8 |
| D | 1 | 52 | 9372493 | 11078.73 | 3715 | 3622 | 845.7 |
| D | 12 | 233 | 974716 | 1148.32 | 3715 | 3622 | 845.7 |
| D | 7 | 38 | 341152 | 399.13 | 3715 | 3622 | 845.7 |
Histogram calculated using DETX and DETY for each event in the final _common_clean file
| Quadrant A | 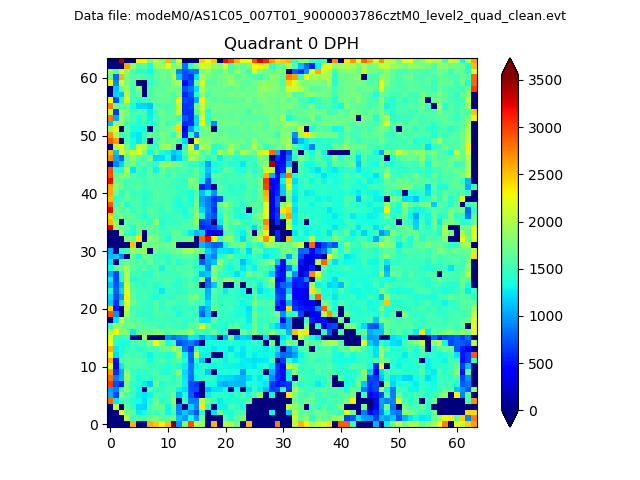 |
 |
Quadrant B |
|---|---|---|---|
| Quadrant D | 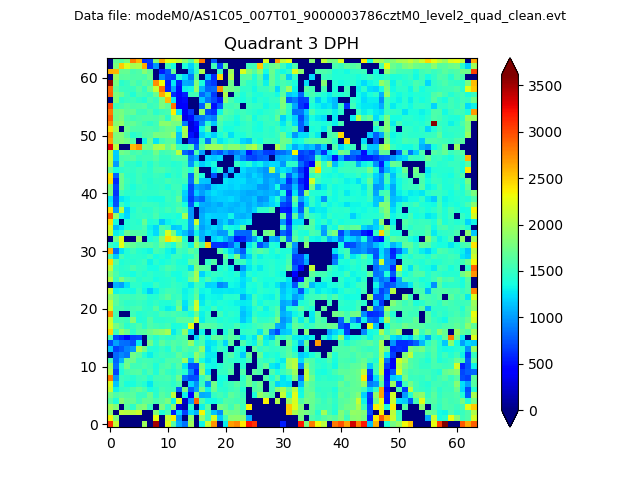 |
 |
Quadrant C |
| Plot type | Count rate plots | Images |
|---|---|---|
| Comparison with Poisson distribution Blue bars denote a histogram of data divided into 1 sec bins. Red curve is a Poisson curve with rate = median count rate of data. |
 |
 |
| Quadrant-wise count rates Data is divided into 100 sec bins |
 |
|
| Module-wise count rates for Quadrant A Data is divided into 100 sec bins |
 |
 |
| Module-wise count rates for Quadrant B Data is divided into 100 sec bins |
 |
 |
| Module-wise count rates for Quadrant C Data is divided into 100 sec bins |
 |
 |
| Module-wise count rates for Quadrant D Data is divided into 100 sec bins |
 |
 |
| Parameter | Plot |
|---|---|
| CZT HV Monitor |  |
| D_VDD |  |
| Temperature 1 |  |
| Veto HV Monitor |  |
| Veto LLD |  |
| Alpha Counter |  |
| _CPM_Rate |  |
| CZT Counter |  |
| +2.5 Volts monitor |  |
| +5 Volts monitor |  |
| _ROLL_ROT |  |
| _Roll_DEC |  |
| _Roll_RA |  |
| Veto Counter |  |