| Param | Original file | Final file |
|---|---|---|
| Filename | modeM0/AS1A09_012T04_9000003784cztM0_level2_bc.evt | modeM0/AS1A09_012T04_9000003784cztM0_level2_quad_clean.evt |
| Size (bytes) | 432,884,160 | 205,223,040 |
| Size | 412.8 MB | 195.7 MB |
| Events in quadrant A | 2,781,923 | 1,371,452 |
| Events in quadrant B | 2,280,208 | 1,396,109 |
| Events in quadrant C | 2,543,360 | 1,368,649 |
| Events in quadrant D | 4,762,223 | 1,332,600 |
| Mode M9 | |||
|---|---|---|---|
| Quadrant | BADHDUFLAG | Total packets | Discarded packets |
| A | 0 | 5 | 0 |
| B | 0 | 5 | 0 |
| C | 0 | 5 | 0 |
| D | 0 | 5 | 0 |
| Mode SS | |||
|---|---|---|---|
| Quadrant | BADHDUFLAG | Total packets | Discarded packets |
| A | 0 | 220 | 0 |
| B | 0 | 220 | 0 |
| C | 0 | 220 | 0 |
| D | 0 | 220 | 0 |
| Mode M0 | |||
|---|---|---|---|
| Quadrant | BADHDUFLAG | Total packets | Discarded packets |
| A | 0 | 24244 | 0 |
| B | 0 | 22645 | 0 |
| C | 0 | 23645 | 0 |
| D | 0 | 31168 | 0 |
| Quadrant | Total seconds | Saturated seconds | Saturation percentage |
|---|---|---|---|
| A | 10787 | 353 | 3.272458% |
| B | 10787 | 303 | 2.808937% |
| C | 10787 | 316 | 2.929452% |
| D | 10787 | 642 | 5.951608% |
Noise dominated data is calculated using 1-second bins in cleaned event files. If a bin has >2000 counts, and if more than 50% of those come from <1% of pixels, then it is considered to be noise-dominated and hence unusable.
| Quadrant | # 1 sec bins | Bins with >0 counts | Bins with >2000 counts | High rate bins dominated by noise | Noise dominated (total time) | Noise dominated (detector-on time) | Marked lightcurve |
|---|---|---|---|---|---|---|---|
| A | 11337 | 10788 | 15 | 15 | 0.13% | 0.14% |  |
| B | 11337 | 10787 | 0 | 0 | 0.00% | 0.00% |  |
| C | 11337 | 10787 | 0 | 0 | 0.00% | 0.00% |  |
| D | 11337 | 10787 | 11 | 11 | 0.10% | 0.10% |  |
Top three noisy pixels from each quadrant. If the there are fewer than three noisy pixels in the level2.evt file, extra rows are filled as -1
| Pixel properties | Quadrant properties | ||||||
|---|---|---|---|---|---|---|---|
| Quadrant | DetID | PixID | Counts | Sigma | Mean | Median | Sigma |
| A | 0 | 13 | 650921 | 5330.33 | 551 | 540 | 122.0 |
| A | 13 | 254 | 16340 | 129.49 | 551 | 540 | 122.0 |
| A | 0 | 226 | 3463 | 23.96 | 551 | 540 | 122.0 |
| B | 0 | 190 | 85436 | 781.53 | 556 | 543 | 108.6 |
| B | 0 | 230 | 30685 | 277.49 | 556 | 543 | 108.6 |
| B | 5 | 172 | 15888 | 141.27 | 556 | 543 | 108.6 |
| C | 2 | 16 | 263173 | 1993.15 | 544 | 540 | 131.8 |
| C | 3 | 233 | 173501 | 1312.62 | 544 | 540 | 131.8 |
| C | 8 | 128 | 10948 | 78.99 | 544 | 540 | 131.8 |
| D | 1 | 52 | 1810510 | 13934.95 | 546 | 528 | 129.9 |
| D | 12 | 233 | 683269 | 5256.38 | 546 | 528 | 129.9 |
| D | 13 | 168 | 96345 | 737.69 | 546 | 528 | 129.9 |
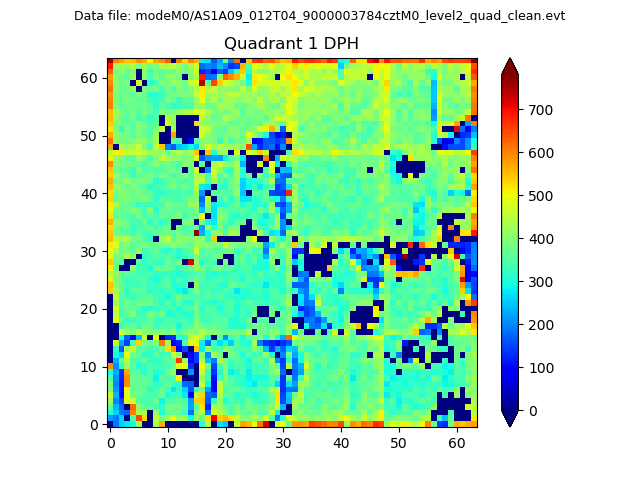
Histogram calculated using DETX and DETY for each event in the final _common_clean file
| Quadrant A |  |
 |
Quadrant B |
|---|---|---|---|
| Quadrant D | 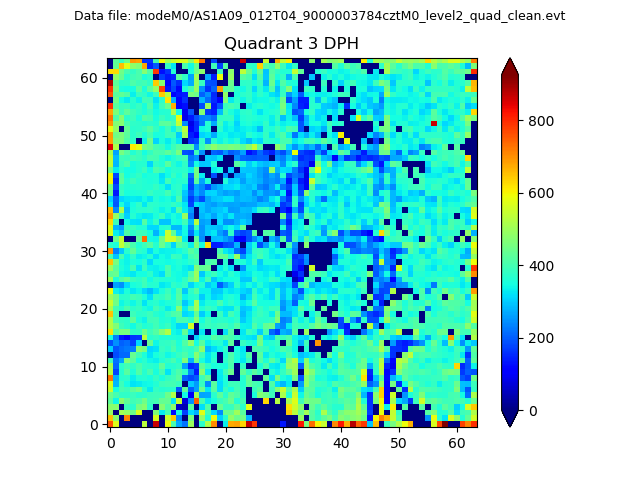 |
 |
Quadrant C |
| Plot type | Count rate plots | Images |
|---|---|---|
| Comparison with Poisson distribution Blue bars denote a histogram of data divided into 1 sec bins. Red curve is a Poisson curve with rate = median count rate of data. |
 |
 |
| Quadrant-wise count rates Data is divided into 100 sec bins |
 |
|
| Module-wise count rates for Quadrant A Data is divided into 100 sec bins |
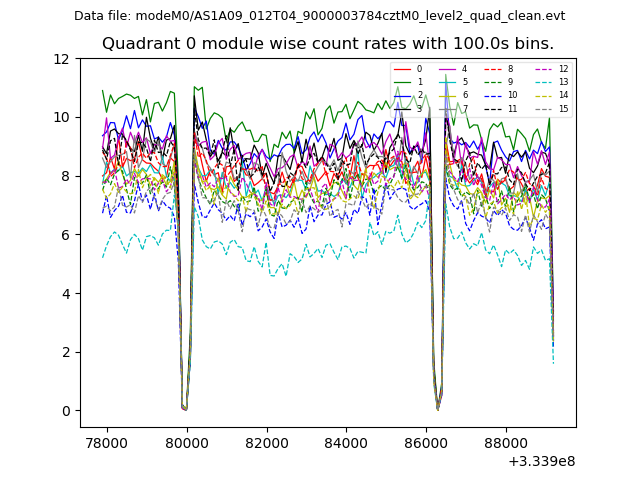 |
 |
| Module-wise count rates for Quadrant B Data is divided into 100 sec bins |
 |
 |
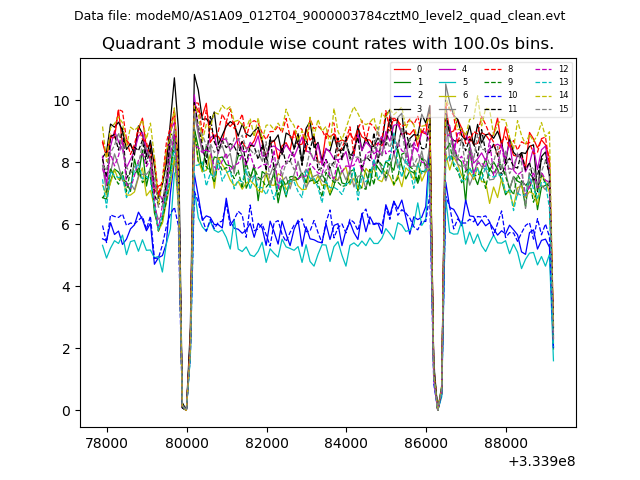
| Module-wise count rates for Quadrant C Data is divided into 100 sec bins |
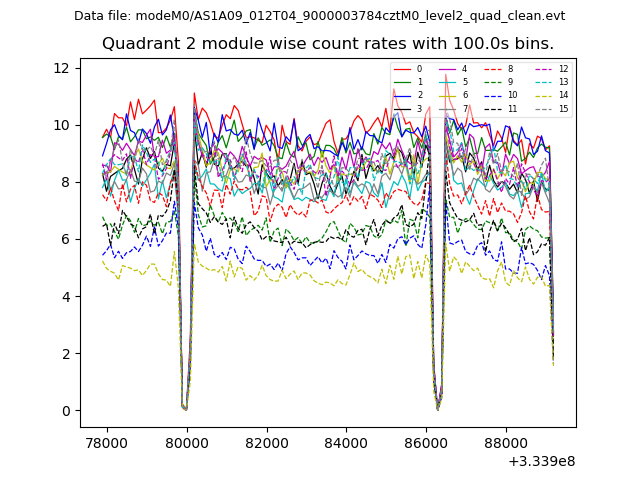 |
 |
| Module-wise count rates for Quadrant D Data is divided into 100 sec bins |
 |
 |
| Parameter | Plot |
|---|---|
| CZT HV Monitor |  |
| D_VDD |  |
| Temperature 1 |  |
| Veto HV Monitor |  |
| Veto LLD |  |
| Alpha Counter |  |
| _CPM_Rate |  |
| CZT Counter |  |
| +2.5 Volts monitor |  |
| +5 Volts monitor |  |
| _ROLL_ROT |  |
| _Roll_DEC |  |
| _Roll_RA |  |
| Veto Counter |  |