| Param | Original file | Final file |
|---|---|---|
| Filename | modeM0/AS1A09_012T02_9000003780cztM0_level2_bc.evt | modeM0/AS1A09_012T02_9000003780cztM0_level2_quad_clean.evt |
| Size (bytes) | 1,077,560,640 | 588,375,360 |
| Size | 1.0 GB | 561.1 MB |
| Events in quadrant A | 6,195,031 | 3,989,873 |
| Events in quadrant B | 7,041,042 | 4,082,016 |
| Events in quadrant C | 6,483,227 | 4,013,125 |
| Events in quadrant D | 11,057,721 | 3,868,420 |
| Mode M0 | |||
|---|---|---|---|
| Quadrant | BADHDUFLAG | Total packets | Discarded packets |
| A | 0 | 56422 | 0 |
| B | 0 | 59894 | 0 |
| C | 0 | 58609 | 0 |
| D | 0 | 73856 | 0 |
| Mode SS | |||
|---|---|---|---|
| Quadrant | BADHDUFLAG | Total packets | Discarded packets |
| A | 0 | 554 | 0 |
| B | 0 | 554 | 0 |
| C | 0 | 554 | 0 |
| D | 0 | 554 | 0 |
| Mode M9 | |||
|---|---|---|---|
| Quadrant | BADHDUFLAG | Total packets | Discarded packets |
| A | 0 | 65 | 0 |
| B | 0 | 65 | 0 |
| C | 0 | 65 | 0 |
| D | 0 | 65 | 0 |
| Quadrant | Total seconds | Saturated seconds | Saturation percentage |
|---|---|---|---|
| A | 27209 | 103 | 0.378551% |
| B | 27209 | 176 | 0.646845% |
| C | 27209 | 397 | 1.459076% |
| D | 27209 | 1019 | 3.745084% |
Noise dominated data is calculated using 1-second bins in cleaned event files. If a bin has >2000 counts, and if more than 50% of those come from <1% of pixels, then it is considered to be noise-dominated and hence unusable.
| Quadrant | # 1 sec bins | Bins with >0 counts | Bins with >2000 counts | High rate bins dominated by noise | Noise dominated (total time) | Noise dominated (detector-on time) | Marked lightcurve |
|---|---|---|---|---|---|---|---|
| A | 33639 | 27211 | 0 | 0 | 0.00% | 0.00% |  |
| B | 33639 | 27209 | 0 | 0 | 0.00% | 0.00% | 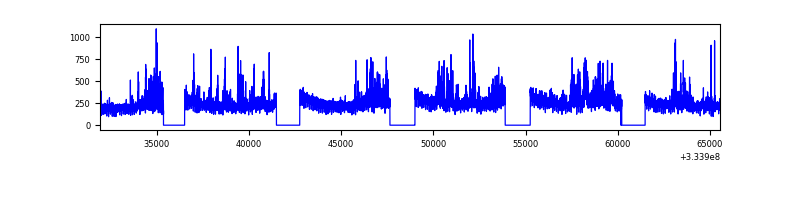 |
| C | 33639 | 27209 | 0 | 0 | 0.00% | 0.00% |  |
| D | 33639 | 27209 | 182 | 182 | 0.54% | 0.67% | 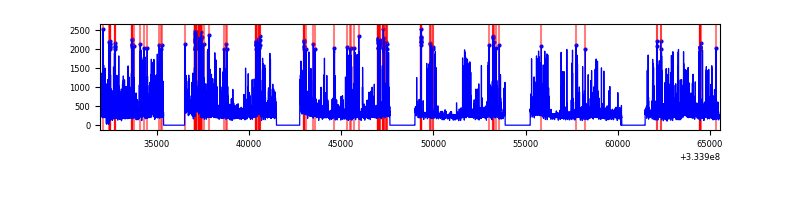 |
Top three noisy pixels from each quadrant. If the there are fewer than three noisy pixels in the level2.evt file, extra rows are filled as -1
| Pixel properties | Quadrant properties | ||||||
|---|---|---|---|---|---|---|---|
| Quadrant | DetID | PixID | Counts | Sigma | Mean | Median | Sigma |
| A | 13 | 254 | 40186 | 114.27 | 1604 | 1583 | 337.8 |
| A | 0 | 13 | 12305 | 31.74 | 1604 | 1583 | 337.8 |
| A | 0 | 226 | 10430 | 26.19 | 1604 | 1583 | 337.8 |
| B | 3 | 112 | 400717 | 1343.91 | 1626 | 1596 | 297.0 |
| B | 0 | 190 | 265924 | 890.04 | 1626 | 1596 | 297.0 |
| B | 0 | 230 | 151017 | 503.13 | 1626 | 1596 | 297.0 |
| C | 3 | 233 | 217521 | 570.21 | 1603 | 1606 | 378.7 |
| C | 2 | 16 | 91728 | 238.0 | 1603 | 1606 | 378.7 |
| C | 0 | 10 | 13499 | 31.41 | 1603 | 1606 | 378.7 |
| D | 1 | 52 | 4658147 | 12759.79 | 1592 | 1557 | 364.9 |
| D | 2 | 234 | 115465 | 312.13 | 1592 | 1557 | 364.9 |
| D | 12 | 233 | 85338 | 229.57 | 1592 | 1557 | 364.9 |
Histogram calculated using DETX and DETY for each event in the final _common_clean file
| Quadrant A |  |
 |
Quadrant B |
|---|---|---|---|
| Quadrant D |  |
 |
Quadrant C |
| Plot type | Count rate plots | Images |
|---|---|---|
| Comparison with Poisson distribution Blue bars denote a histogram of data divided into 1 sec bins. Red curve is a Poisson curve with rate = median count rate of data. |
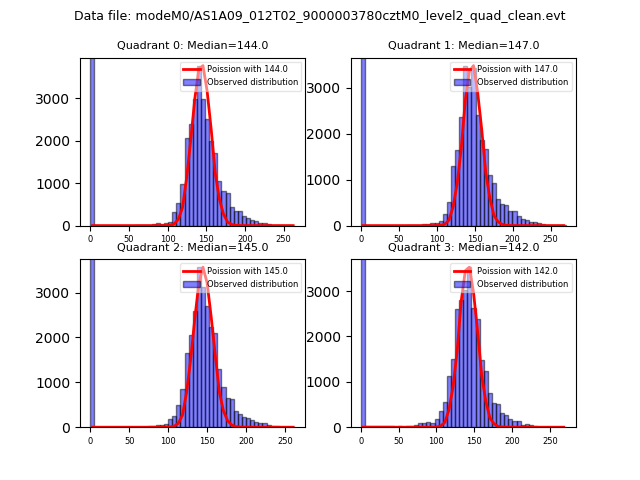 |
 |
| Quadrant-wise count rates Data is divided into 100 sec bins |
 |
|
| Module-wise count rates for Quadrant A Data is divided into 100 sec bins |
 |
 |
| Module-wise count rates for Quadrant B Data is divided into 100 sec bins |
 |
 |
| Module-wise count rates for Quadrant C Data is divided into 100 sec bins |
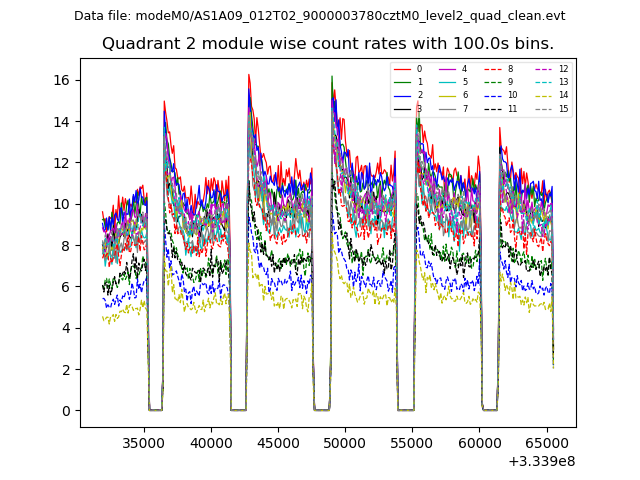 |
 |
| Module-wise count rates for Quadrant D Data is divided into 100 sec bins |
 |
 |
| Parameter | Plot |
|---|---|
| CZT HV Monitor |  |
| D_VDD |  |
| Temperature 1 | 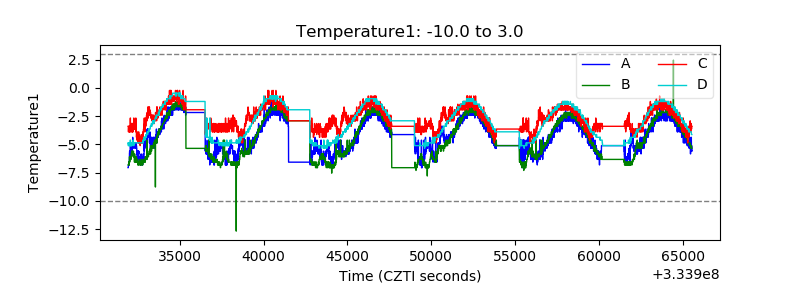 |
| Veto HV Monitor | 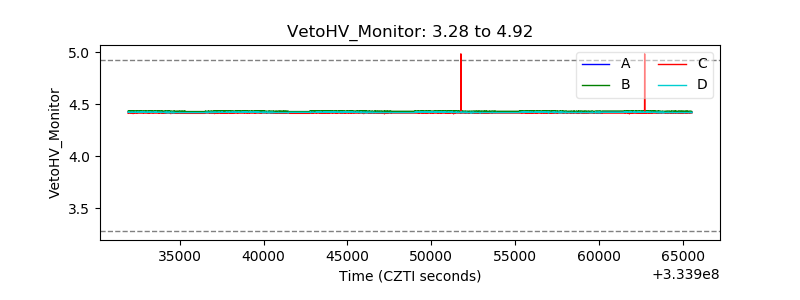 |
| Veto LLD |  |
| Alpha Counter |  |
| _CPM_Rate |  |
| CZT Counter | 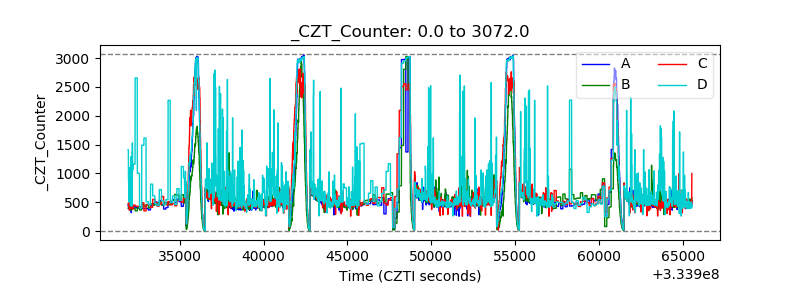 |
| +2.5 Volts monitor |  |
| +5 Volts monitor |  |
| _ROLL_ROT | 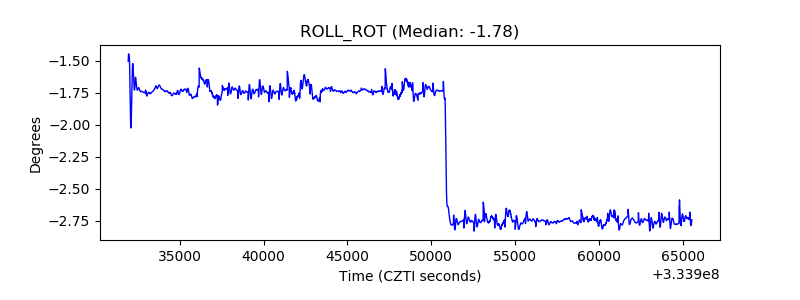 |
| _Roll_DEC | 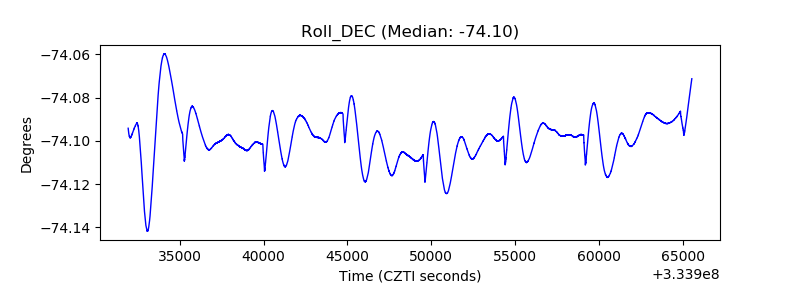 |
| _Roll_RA |  |
| Veto Counter |  |