| Param | Original file | Final file |
|---|---|---|
| Filename | modeM0/AS1A09_012T01_9000003778cztM0_level2_bc.evt | modeM0/AS1A09_012T01_9000003778cztM0_level2_quad_clean.evt |
| Size (bytes) | 347,155,200 | 159,520,320 |
| Size | 331.1 MB | 152.1 MB |
| Events in quadrant A | 1,875,265 | 1,062,296 |
| Events in quadrant B | 1,977,176 | 1,081,122 |
| Events in quadrant C | 1,937,192 | 1,047,693 |
| Events in quadrant D | 4,093,069 | 1,005,522 |
| Mode M0 | |||
|---|---|---|---|
| Quadrant | BADHDUFLAG | Total packets | Discarded packets |
| A | 0 | 18666 | 0 |
| B | 0 | 19223 | 0 |
| C | 0 | 19044 | 0 |
| D | 0 | 27065 | 0 |
| Mode M9 | |||
|---|---|---|---|
| Quadrant | BADHDUFLAG | Total packets | Discarded packets |
| A | 0 | 19 | 0 |
| B | 0 | 19 | 0 |
| C | 0 | 19 | 0 |
| D | 0 | 19 | 0 |
| Mode SS | |||
|---|---|---|---|
| Quadrant | BADHDUFLAG | Total packets | Discarded packets |
| A | 0 | 188 | 0 |
| B | 0 | 188 | 0 |
| C | 0 | 188 | 0 |
| D | 0 | 188 | 0 |
| Quadrant | Total seconds | Saturated seconds | Saturation percentage |
|---|---|---|---|
| A | 9151 | 34 | 0.371544% |
| B | 9151 | 66 | 0.721233% |
| C | 9151 | 125 | 1.365971% |
| D | 9151 | 496 | 5.420173% |
Noise dominated data is calculated using 1-second bins in cleaned event files. If a bin has >2000 counts, and if more than 50% of those come from <1% of pixels, then it is considered to be noise-dominated and hence unusable.
| Quadrant | # 1 sec bins | Bins with >0 counts | Bins with >2000 counts | High rate bins dominated by noise | Noise dominated (total time) | Noise dominated (detector-on time) | Marked lightcurve |
|---|---|---|---|---|---|---|---|
| A | 11016 | 9151 | 0 | 0 | 0.00% | 0.00% |  |
| B | 11016 | 9152 | 0 | 0 | 0.00% | 0.00% |  |
| C | 11016 | 9151 | 2 | 2 | 0.02% | 0.02% | 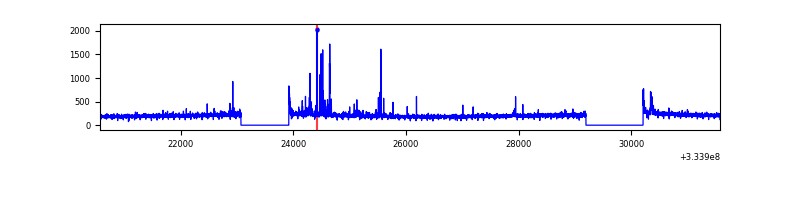 |
| D | 11016 | 9151 | 37 | 37 | 0.34% | 0.40% |  |
Top three noisy pixels from each quadrant. If the there are fewer than three noisy pixels in the level2.evt file, extra rows are filled as -1
| Pixel properties | Quadrant properties | ||||||
|---|---|---|---|---|---|---|---|
| Quadrant | DetID | PixID | Counts | Sigma | Mean | Median | Sigma |
| A | 13 | 254 | 14651 | 132.45 | 481 | 472 | 107.0 |
| A | 0 | 13 | 6304 | 54.48 | 481 | 472 | 107.0 |
| A | 5 | 98 | 5160 | 43.79 | 481 | 472 | 107.0 |
| B | 0 | 190 | 67800 | 702.13 | 486 | 473 | 95.9 |
| B | 5 | 172 | 18298 | 185.89 | 486 | 473 | 95.9 |
| B | 0 | 230 | 16017 | 162.1 | 486 | 473 | 95.9 |
| C | 2 | 16 | 73350 | 650.27 | 470 | 467 | 112.1 |
| C | 3 | 233 | 47173 | 416.72 | 470 | 467 | 112.1 |
| C | 0 | 10 | 4288 | 34.09 | 470 | 467 | 112.1 |
| D | 1 | 52 | 2045361 | 18733.53 | 465 | 453 | 109.2 |
| D | 12 | 233 | 214017 | 1956.47 | 465 | 453 | 109.2 |
| D | 2 | 234 | 42502 | 385.21 | 465 | 453 | 109.2 |
Histogram calculated using DETX and DETY for each event in the final _common_clean file
| Quadrant A | 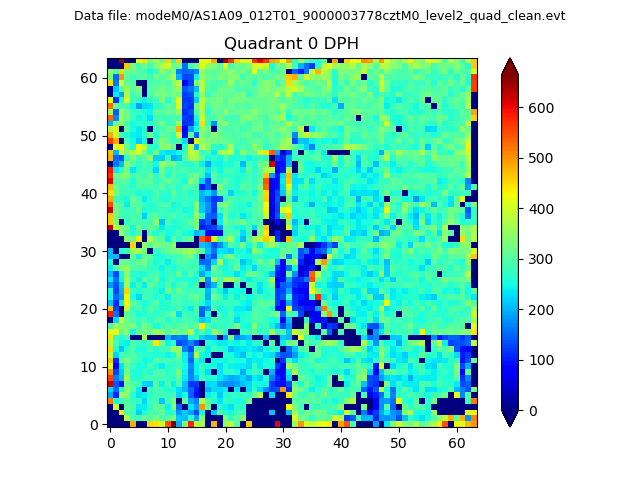 |
 |
Quadrant B |
|---|---|---|---|
| Quadrant D |  |
 |
Quadrant C |
| Plot type | Count rate plots | Images |
|---|---|---|
| Comparison with Poisson distribution Blue bars denote a histogram of data divided into 1 sec bins. Red curve is a Poisson curve with rate = median count rate of data. |
 |
 |
| Quadrant-wise count rates Data is divided into 100 sec bins |
 |
|
| Module-wise count rates for Quadrant A Data is divided into 100 sec bins |
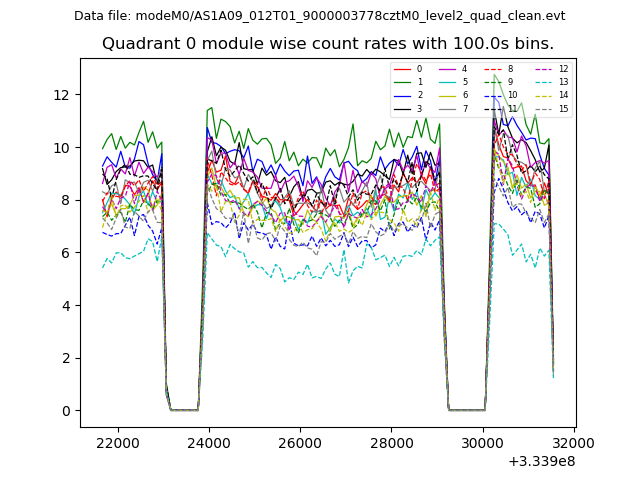 |
 |
| Module-wise count rates for Quadrant B Data is divided into 100 sec bins |
 |
 |
| Module-wise count rates for Quadrant C Data is divided into 100 sec bins |
 |
 |
| Module-wise count rates for Quadrant D Data is divided into 100 sec bins |
 |
 |
| Parameter | Plot |
|---|---|
| CZT HV Monitor |  |
| D_VDD |  |
| Temperature 1 |  |
| Veto HV Monitor |  |
| Veto LLD |  |
| Alpha Counter |  |
| _CPM_Rate | 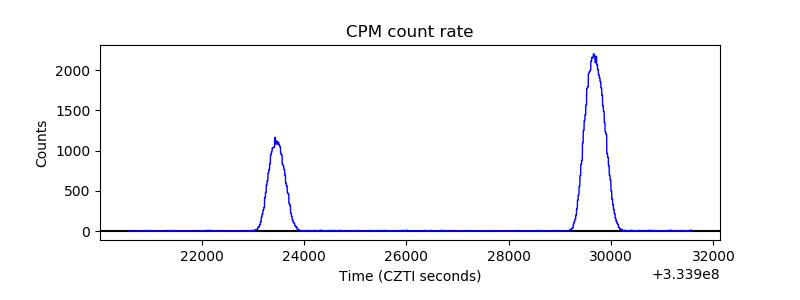 |
| CZT Counter |  |
| +2.5 Volts monitor |  |
| +5 Volts monitor |  |
| _ROLL_ROT |  |
| _Roll_DEC | 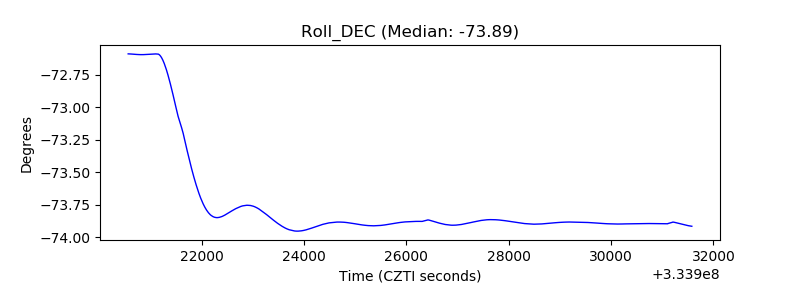 |
| _Roll_RA | 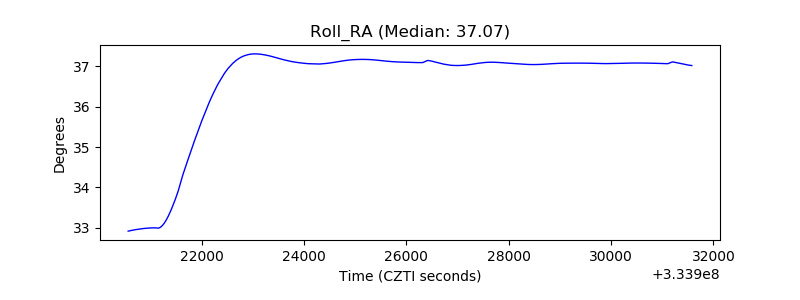 |
| Veto Counter |  |