| Param | Original file | Final file |
|---|---|---|
| Filename | modeM0/AS1A09_138T04_9000003776cztM0_level2_bc.evt | modeM0/AS1A09_138T04_9000003776cztM0_level2_quad_clean.evt |
| Size (bytes) | 12,824,245,440 | 4,559,572,800 |
| Size | 11.9 GB | 4.2 GB |
| Events in quadrant A | 94,738,895 | 29,050,472 |
| Events in quadrant B | 72,983,980 | 30,043,536 |
| Events in quadrant C | 78,652,127 | 28,517,855 |
| Events in quadrant D | 119,689,817 | 28,031,019 |
| Mode M9 | |||
|---|---|---|---|
| Quadrant | BADHDUFLAG | Total packets | Discarded packets |
| A | 0 | 518 | 0 |
| B | 0 | 518 | 0 |
| C | 0 | 518 | 0 |
| D | 0 | 518 | 0 |
| Mode SS | |||
|---|---|---|---|
| Quadrant | BADHDUFLAG | Total packets | Discarded packets |
| A | 0 | 6678 | 0 |
| B | 0 | 6678 | 0 |
| C | 0 | 6678 | 0 |
| D | 0 | 6678 | 0 |
| Mode M0 | |||
|---|---|---|---|
| Quadrant | BADHDUFLAG | Total packets | Discarded packets |
| A | 0 | 769009 | 0 |
| B | 0 | 692110 | 0 |
| C | 0 | 722975 | 0 |
| D | 0 | 854321 | 0 |
| Quadrant | Total seconds | Saturated seconds | Saturation percentage |
|---|---|---|---|
| A | 328107 | 9590 | 2.922827% |
| B | 328106 | 5264 | 1.604360% |
| C | 328107 | 8166 | 2.488822% |
| D | 328107 | 14803 | 4.511638% |
Noise dominated data is calculated using 1-second bins in cleaned event files. If a bin has >2000 counts, and if more than 50% of those come from <1% of pixels, then it is considered to be noise-dominated and hence unusable.
| Quadrant | # 1 sec bins | Bins with >0 counts | Bins with >2000 counts | High rate bins dominated by noise | Noise dominated (total time) | Noise dominated (detector-on time) | Marked lightcurve |
|---|---|---|---|---|---|---|---|
| A | 378517 | 328073 | 511 | 511 | 0.14% | 0.16% |  |
| B | 378516 | 328061 | 3 | 3 | 0.00% | 0.00% |  |
| C | 378516 | 328062 | 210 | 210 | 0.06% | 0.06% | 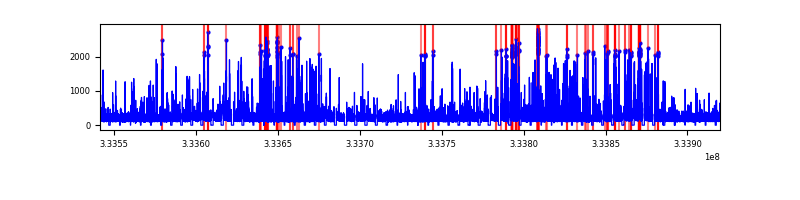 |
| D | 378516 | 328067 | 2714 | 2714 | 0.72% | 0.83% |  |
Top three noisy pixels from each quadrant. If the there are fewer than three noisy pixels in the level2.evt file, extra rows are filled as -1
| Pixel properties | Quadrant properties | ||||||
|---|---|---|---|---|---|---|---|
| Quadrant | DetID | PixID | Counts | Sigma | Mean | Median | Sigma |
| A | 0 | 13 | 25060199 | 6554.48 | 17933 | 17641 | 3820.7 |
| A | 13 | 254 | 475878 | 119.94 | 17933 | 17641 | 3820.7 |
| A | 6 | 16 | 320438 | 79.25 | 17933 | 17641 | 3820.7 |
| B | 0 | 190 | 845830 | 244.93 | 18239 | 17804 | 3380.7 |
| B | 0 | 229 | 826326 | 239.16 | 18239 | 17804 | 3380.7 |
| B | 0 | 230 | 673395 | 193.92 | 18239 | 17804 | 3380.7 |
| C | 2 | 16 | 6377131 | 1550.6 | 17513 | 17477 | 4101.4 |
| C | 3 | 233 | 4474921 | 1086.8 | 17513 | 17477 | 4101.4 |
| C | 13 | 250 | 314503 | 72.42 | 17513 | 17477 | 4101.4 |
| D | 1 | 52 | 34450562 | 8486.19 | 17679 | 17209 | 4057.6 |
| D | 7 | 80 | 8724066 | 2145.83 | 17679 | 17209 | 4057.6 |
| D | 12 | 233 | 4615425 | 1133.24 | 17679 | 17209 | 4057.6 |
Histogram calculated using DETX and DETY for each event in the final _common_clean file
| Quadrant A |  |
 |
Quadrant B |
|---|---|---|---|
| Quadrant D |  |
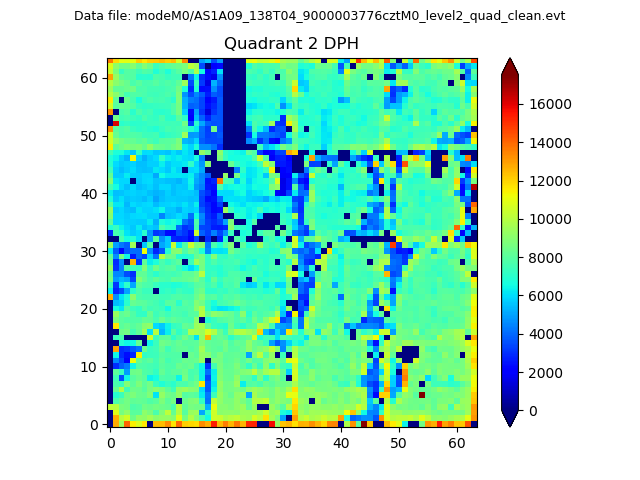 |
Quadrant C |
| Plot type | Count rate plots | Images |
|---|---|---|
| Comparison with Poisson distribution Blue bars denote a histogram of data divided into 1 sec bins. Red curve is a Poisson curve with rate = median count rate of data. |
 |
 |
| Quadrant-wise count rates Data is divided into 100 sec bins |
 |
|
| Module-wise count rates for Quadrant A Data is divided into 100 sec bins |
 |
 |
| Module-wise count rates for Quadrant B Data is divided into 100 sec bins |
 |
 |
| Module-wise count rates for Quadrant C Data is divided into 100 sec bins |
 |
 |
| Module-wise count rates for Quadrant D Data is divided into 100 sec bins |
 |
 |
| Parameter | Plot |
|---|---|
| CZT HV Monitor |  |
| D_VDD |  |
| Temperature 1 |  |
| Veto HV Monitor |  |
| Veto LLD |  |
| Alpha Counter | 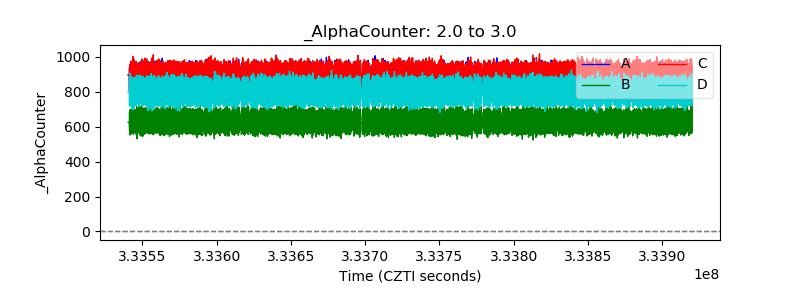 |
| _CPM_Rate |  |
| CZT Counter |  |
| +2.5 Volts monitor |  |
| +5 Volts monitor |  |
| _ROLL_ROT |  |
| _Roll_DEC | 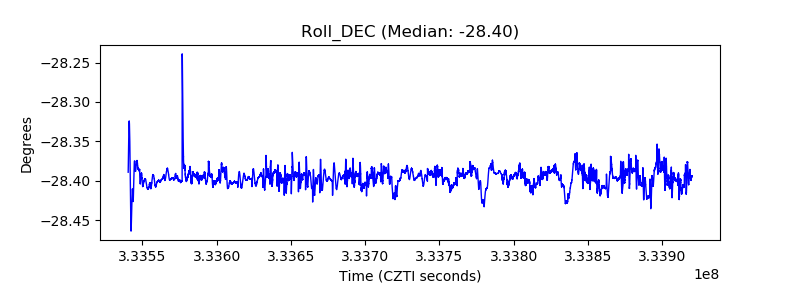 |
| _Roll_RA |  |
| Veto Counter |  |