| Param | Original file | Final file |
|---|---|---|
| Filename | modeM0/AS1T03_218T01_9000003770cztM0_level2_bc.evt | modeM0/AS1T03_218T01_9000003770cztM0_level2_quad_clean.evt |
| Size (bytes) | 629,539,200 | 251,879,040 |
| Size | 600.4 MB | 240.2 MB |
| Events in quadrant A | 4,590,261 | 1,655,698 |
| Events in quadrant B | 4,251,268 | 1,669,497 |
| Events in quadrant C | 3,964,925 | 1,563,451 |
| Events in quadrant D | 5,092,915 | 1,566,502 |
| Mode SS | |||
|---|---|---|---|
| Quadrant | BADHDUFLAG | Total packets | Discarded packets |
| A | 0 | 344 | 0 |
| B | 0 | 344 | 0 |
| C | 0 | 344 | 0 |
| D | 0 | 344 | 0 |
| Mode M0 | |||
|---|---|---|---|
| Quadrant | BADHDUFLAG | Total packets | Discarded packets |
| A | 0 | 38267 | 0 |
| B | 0 | 37023 | 0 |
| C | 0 | 36507 | 0 |
| D | 0 | 38973 | 0 |
| Mode M9 | |||
|---|---|---|---|
| Quadrant | BADHDUFLAG | Total packets | Discarded packets |
| A | 0 | 40 | 0 |
| B | 0 | 40 | 0 |
| C | 0 | 40 | 0 |
| D | 0 | 40 | 0 |
| Quadrant | Total seconds | Saturated seconds | Saturation percentage |
|---|---|---|---|
| A | 17038 | 225 | 1.320578% |
| B | 17038 | 220 | 1.291231% |
| C | 17037 | 255 | 1.496742% |
| D | 17038 | 135 | 0.792347% |
Noise dominated data is calculated using 1-second bins in cleaned event files. If a bin has >2000 counts, and if more than 50% of those come from <1% of pixels, then it is considered to be noise-dominated and hence unusable.
| Quadrant | # 1 sec bins | Bins with >0 counts | Bins with >2000 counts | High rate bins dominated by noise | Noise dominated (total time) | Noise dominated (detector-on time) | Marked lightcurve |
|---|---|---|---|---|---|---|---|
| A | 20888 | 17036 | 11 | 11 | 0.05% | 0.06% |  |
| B | 20888 | 17035 | 0 | 0 | 0.00% | 0.00% |  |
| C | 20888 | 17035 | 0 | 0 | 0.00% | 0.00% |  |
| D | 20888 | 17035 | 6 | 6 | 0.03% | 0.04% | 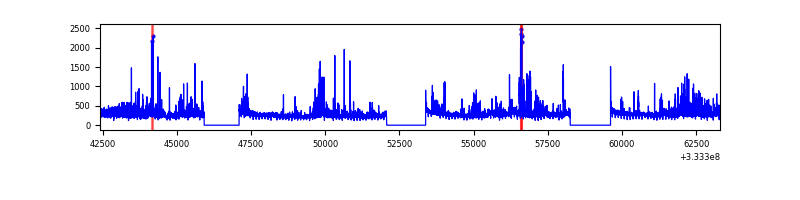 |
Top three noisy pixels from each quadrant. If the there are fewer than three noisy pixels in the level2.evt file, extra rows are filled as -1
| Pixel properties | Quadrant properties | ||||||
|---|---|---|---|---|---|---|---|
| Quadrant | DetID | PixID | Counts | Sigma | Mean | Median | Sigma |
| A | 0 | 13 | 453399 | 1997.9 | 1073 | 1062 | 226.4 |
| A | 13 | 254 | 24609 | 104.0 | 1073 | 1062 | 226.4 |
| A | 11 | 29 | 7117 | 26.74 | 1073 | 1062 | 226.4 |
| B | 0 | 190 | 36968 | 183.82 | 1075 | 1059 | 195.4 |
| B | 0 | 245 | 36043 | 179.08 | 1075 | 1059 | 195.4 |
| B | 4 | 201 | 19539 | 94.6 | 1075 | 1059 | 195.4 |
| C | 5 | 4 | 56985 | 239.48 | 1006 | 1007 | 233.7 |
| C | 3 | 233 | 28383 | 117.12 | 1006 | 1007 | 233.7 |
| C | 2 | 16 | 16177 | 64.9 | 1006 | 1007 | 233.7 |
| D | 1 | 52 | 574251 | 2434.66 | 1037 | 1016 | 235.4 |
| D | 7 | 80 | 400744 | 1697.74 | 1037 | 1016 | 235.4 |
| D | 2 | 234 | 63823 | 266.76 | 1037 | 1016 | 235.4 |
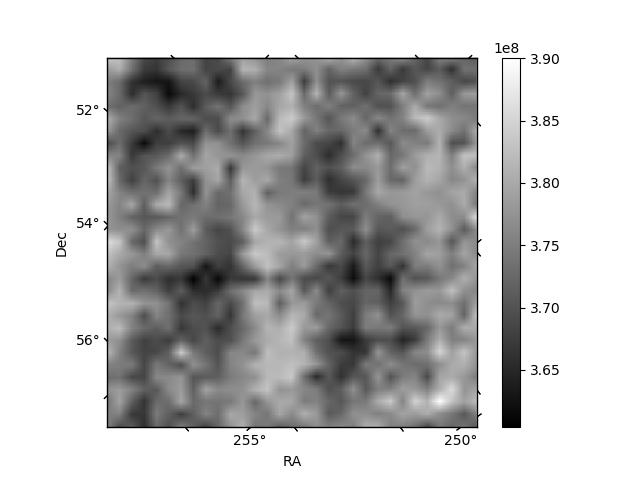
Histogram calculated using DETX and DETY for each event in the final _common_clean file
| Quadrant A |  |
 |
Quadrant B |
|---|---|---|---|
| Quadrant D |  |
 |
Quadrant C |
| Plot type | Count rate plots | Images |
|---|---|---|
| Comparison with Poisson distribution Blue bars denote a histogram of data divided into 1 sec bins. Red curve is a Poisson curve with rate = median count rate of data. |
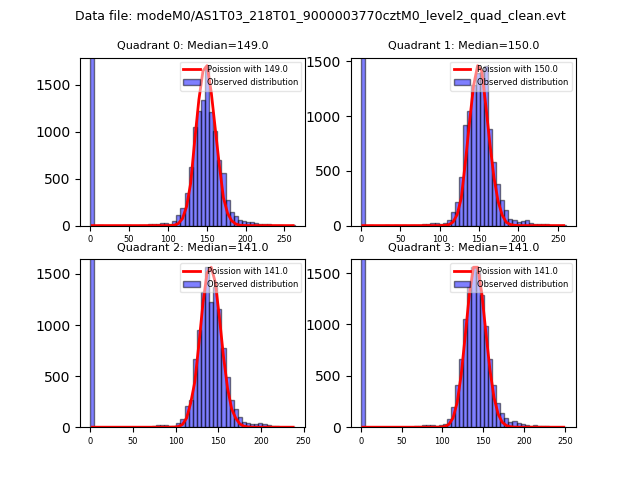 |
 |
| Quadrant-wise count rates Data is divided into 100 sec bins |
 |
|
| Module-wise count rates for Quadrant A Data is divided into 100 sec bins |
 |
 |
| Module-wise count rates for Quadrant B Data is divided into 100 sec bins |
 |
 |
| Module-wise count rates for Quadrant C Data is divided into 100 sec bins |
 |
 |
| Module-wise count rates for Quadrant D Data is divided into 100 sec bins |
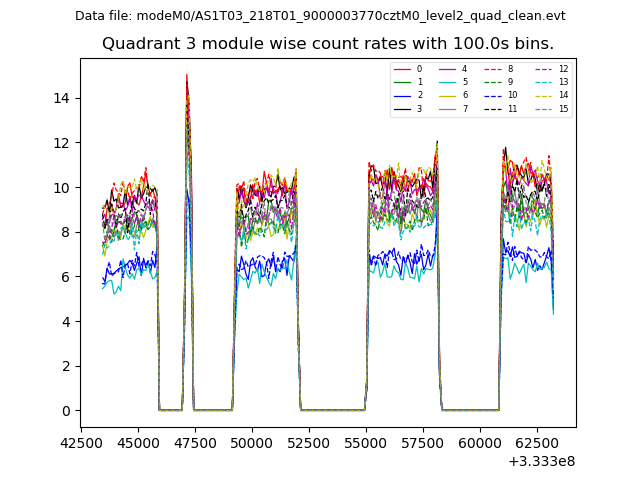 |
 |
| Parameter | Plot |
|---|---|
| CZT HV Monitor | 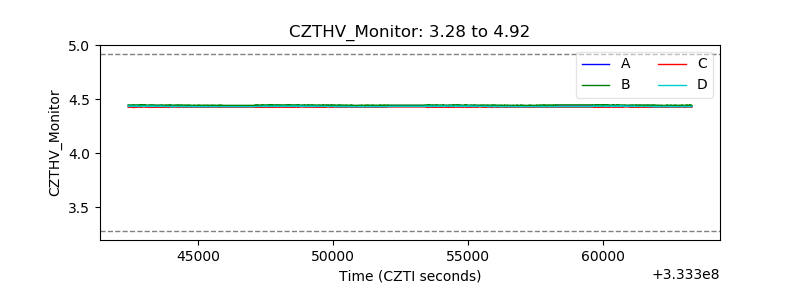 |
| D_VDD | 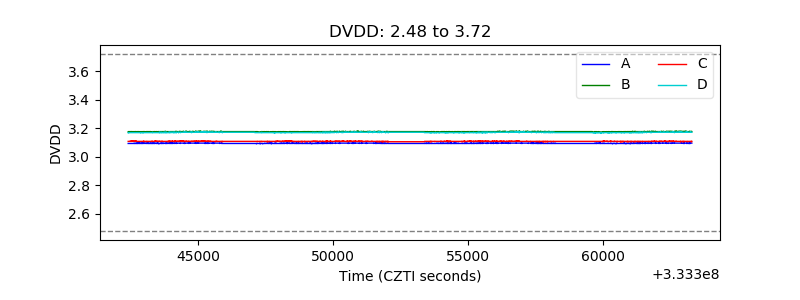 |
| Temperature 1 | 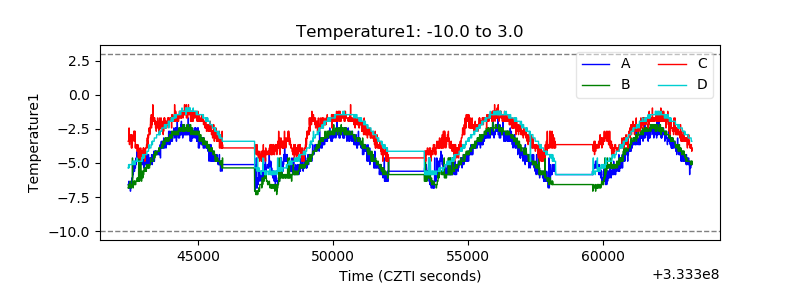 |
| Veto HV Monitor |  |
| Veto LLD | 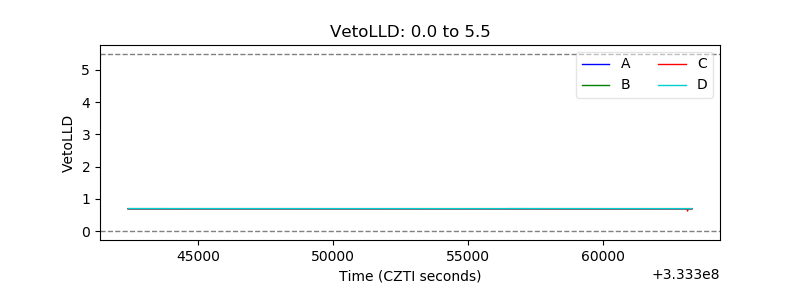 |
| Alpha Counter | 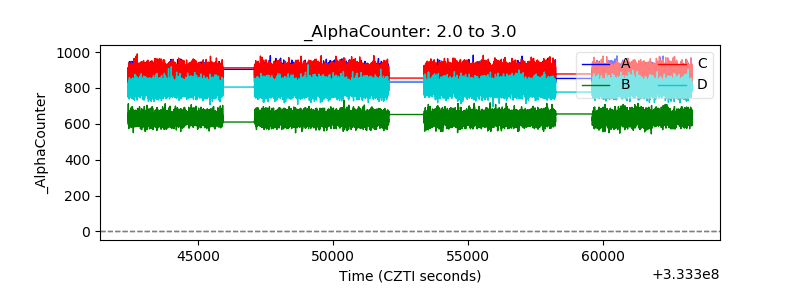 |
| _CPM_Rate |  |
| CZT Counter | 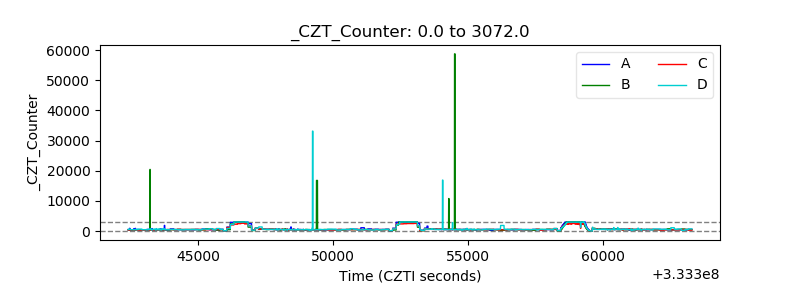 |
| +2.5 Volts monitor |  |
| +5 Volts monitor |  |
| _ROLL_ROT | 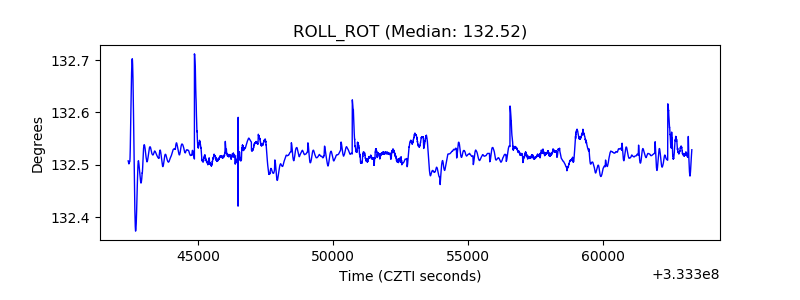 |
| _Roll_DEC |  |
| _Roll_RA |  |
| Veto Counter |  |