| Param | Original file | Final file |
|---|---|---|
| Filename | modeM0/AS1A09_126T01_9000003772cztM0_level2_bc.evt | modeM0/AS1A09_126T01_9000003772cztM0_level2_quad_clean.evt |
| Size (bytes) | 1,457,412,480 | 511,171,200 |
| Size | 1.4 GB | 487.5 MB |
| Events in quadrant A | 8,242,152 | 3,354,171 |
| Events in quadrant B | 8,076,103 | 3,381,168 |
| Events in quadrant C | 7,359,361 | 3,215,175 |
| Events in quadrant D | 18,019,681 | 3,074,930 |
| Mode M0 | |||
|---|---|---|---|
| Quadrant | BADHDUFLAG | Total packets | Discarded packets |
| A | 0 | 76744 | 0 |
| B | 0 | 76289 | 0 |
| C | 0 | 75369 | 0 |
| D | 0 | 108263 | 0 |
| Mode SS | |||
|---|---|---|---|
| Quadrant | BADHDUFLAG | Total packets | Discarded packets |
| A | 0 | 732 | 0 |
| B | 0 | 732 | 0 |
| C | 0 | 732 | 0 |
| D | 0 | 732 | 0 |
| Mode M9 | |||
|---|---|---|---|
| Quadrant | BADHDUFLAG | Total packets | Discarded packets |
| A | 0 | 47 | 0 |
| B | 0 | 47 | 0 |
| C | 0 | 47 | 0 |
| D | 0 | 47 | 0 |
| Quadrant | Total seconds | Saturated seconds | Saturation percentage |
|---|---|---|---|
| A | 35766 | 563 | 1.574121% |
| B | 35766 | 697 | 1.948778% |
| C | 35766 | 843 | 2.356987% |
| D | 35766 | 2524 | 7.056981% |
Noise dominated data is calculated using 1-second bins in cleaned event files. If a bin has >2000 counts, and if more than 50% of those come from <1% of pixels, then it is considered to be noise-dominated and hence unusable.
| Quadrant | # 1 sec bins | Bins with >0 counts | Bins with >2000 counts | High rate bins dominated by noise | Noise dominated (total time) | Noise dominated (detector-on time) | Marked lightcurve |
|---|---|---|---|---|---|---|---|
| A | 40601 | 35765 | 0 | 0 | 0.00% | 0.00% |  |
| B | 40601 | 35762 | 0 | 0 | 0.00% | 0.00% |  |
| C | 40601 | 35762 | 0 | 0 | 0.00% | 0.00% |  |
| D | 40601 | 35760 | 681 | 681 | 1.68% | 1.90% |  |
Top three noisy pixels from each quadrant. If the there are fewer than three noisy pixels in the level2.evt file, extra rows are filled as -1
| Pixel properties | Quadrant properties | ||||||
|---|---|---|---|---|---|---|---|
| Quadrant | DetID | PixID | Counts | Sigma | Mean | Median | Sigma |
| A | 0 | 13 | 441157 | 1013.95 | 2001 | 1972 | 433.1 |
| A | 5 | 98 | 71540 | 160.61 | 2001 | 1972 | 433.1 |
| A | 13 | 254 | 54717 | 121.77 | 2001 | 1972 | 433.1 |
| B | 15 | 33 | 132428 | 346.88 | 2001 | 1963 | 376.1 |
| B | 0 | 190 | 101431 | 264.47 | 2001 | 1963 | 376.1 |
| B | 0 | 229 | 71871 | 185.87 | 2001 | 1963 | 376.1 |
| C | 3 | 233 | 50245 | 108.15 | 1898 | 1892 | 447.1 |
| C | 2 | 16 | 17737 | 35.44 | 1898 | 1892 | 447.1 |
| C | 13 | 61 | 10906 | 20.16 | 1898 | 1892 | 447.1 |
| D | 1 | 52 | 9039110 | 20570.56 | 1900 | 1854 | 439.3 |
| D | 7 | 80 | 890776 | 2023.36 | 1900 | 1854 | 439.3 |
| D | 12 | 233 | 474680 | 1076.24 | 1900 | 1854 | 439.3 |
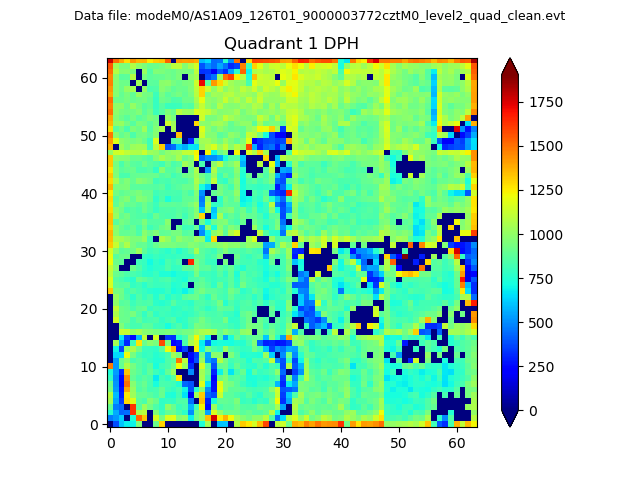
Histogram calculated using DETX and DETY for each event in the final _common_clean file
| Quadrant A |  |
 |
Quadrant B |
|---|---|---|---|
| Quadrant D | 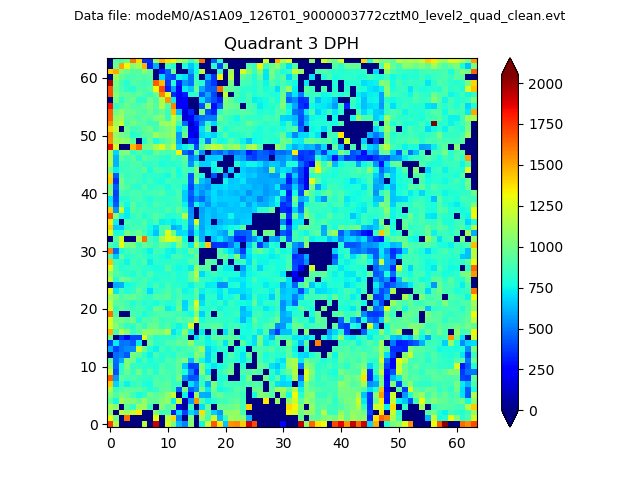 |
 |
Quadrant C |
| Plot type | Count rate plots | Images |
|---|---|---|
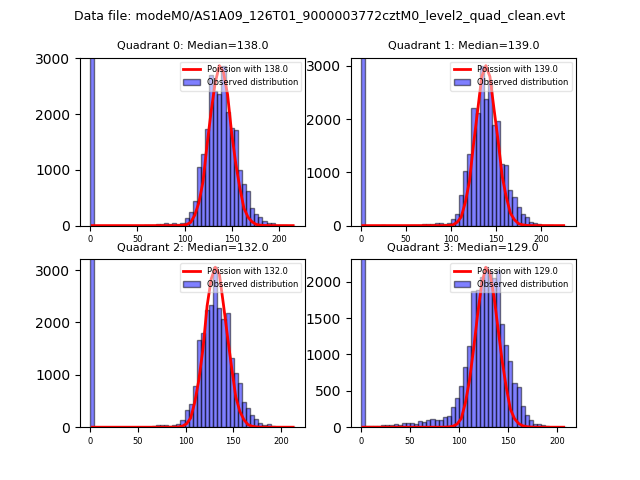
| Comparison with Poisson distribution Blue bars denote a histogram of data divided into 1 sec bins. Red curve is a Poisson curve with rate = median count rate of data. |
 |
 |
| Quadrant-wise count rates Data is divided into 100 sec bins |
 |
|
| Module-wise count rates for Quadrant A Data is divided into 100 sec bins |
 |
 |
| Module-wise count rates for Quadrant B Data is divided into 100 sec bins |
 |
 |
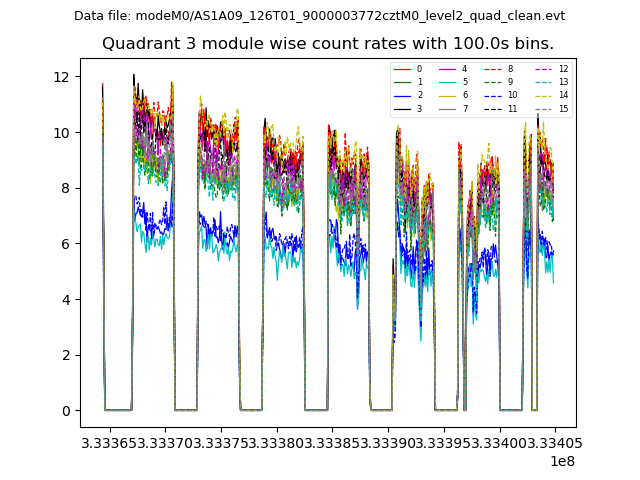
| Module-wise count rates for Quadrant C Data is divided into 100 sec bins |
 |
 |
| Module-wise count rates for Quadrant D Data is divided into 100 sec bins |
 |
 |
| Parameter | Plot |
|---|---|
| CZT HV Monitor | 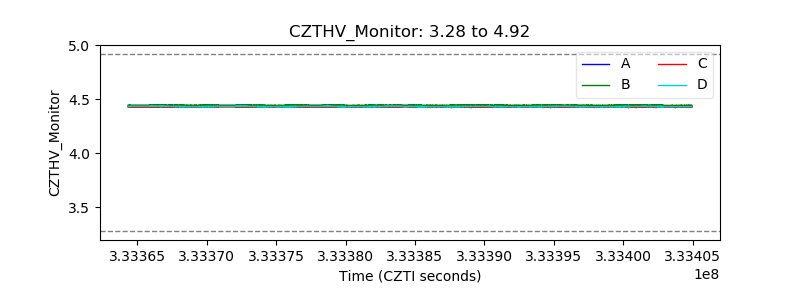 |
| D_VDD |  |
| Temperature 1 |  |
| Veto HV Monitor |  |
| Veto LLD | 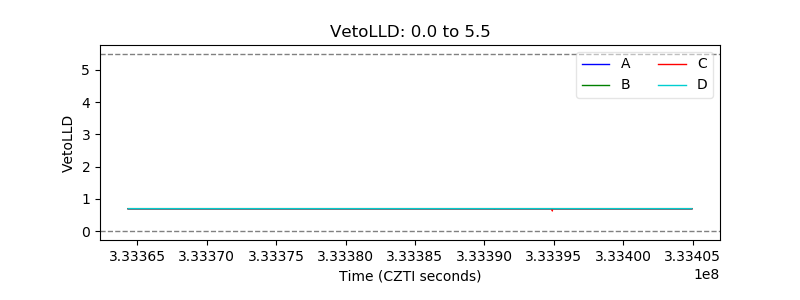 |
| Alpha Counter | 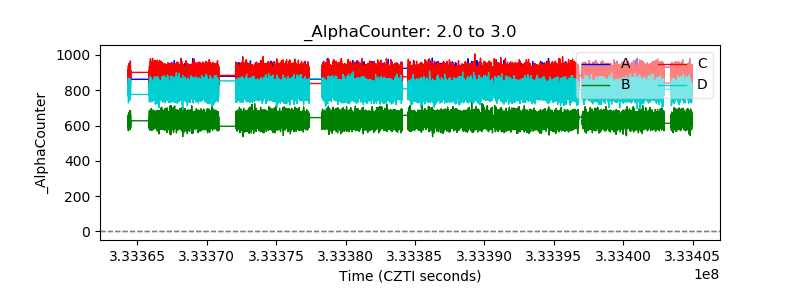 |
| _CPM_Rate | 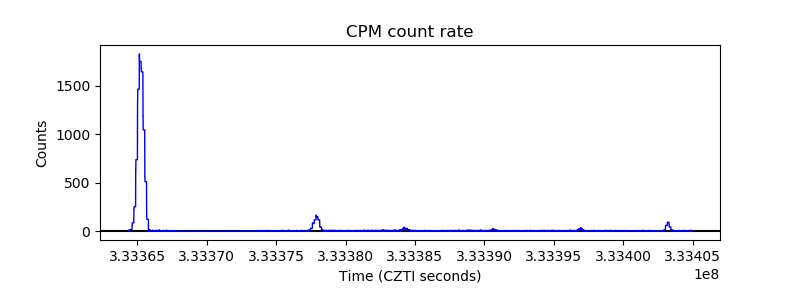 |
| CZT Counter |  |
| +2.5 Volts monitor | 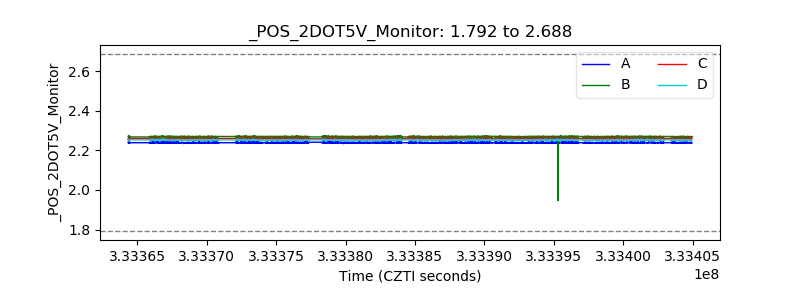 |
| +5 Volts monitor |  |
| _ROLL_ROT |  |
| _Roll_DEC | 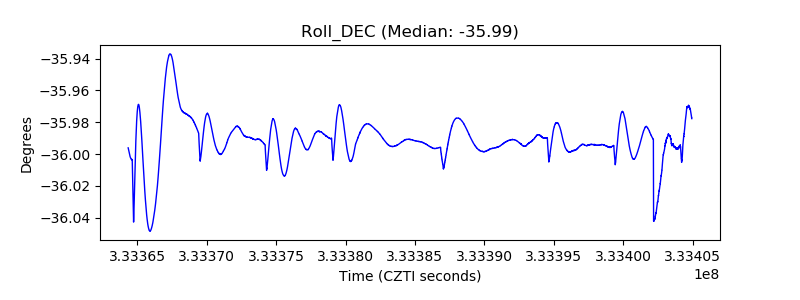 |
| _Roll_RA | 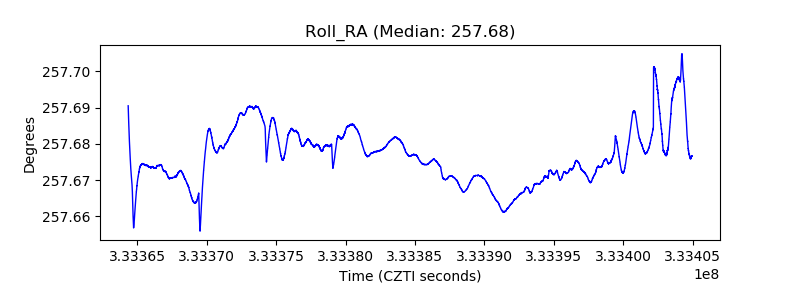 |
| Veto Counter |  |