| Param | Original file | Final file |
|---|---|---|
| Filename | modeM0/AS1A09_113T01_9000003768cztM0_level2_bc.evt | modeM0/AS1A09_113T01_9000003768cztM0_level2_quad_clean.evt |
| Size (bytes) | 1,346,025,600 | 552,447,360 |
| Size | 1.3 GB | 526.9 MB |
| Events in quadrant A | 8,883,591 | 3,523,201 |
| Events in quadrant B | 8,965,279 | 3,554,880 |
| Events in quadrant C | 8,283,271 | 3,402,825 |
| Events in quadrant D | 11,766,433 | 3,370,964 |
| Mode SS | |||
|---|---|---|---|
| Quadrant | BADHDUFLAG | Total packets | Discarded packets |
| A | 0 | 860 | 0 |
| B | 0 | 860 | 0 |
| C | 0 | 860 | 0 |
| D | 0 | 860 | 0 |
| Mode M9 | |||
|---|---|---|---|
| Quadrant | BADHDUFLAG | Total packets | Discarded packets |
| A | 0 | 48 | 0 |
| B | 0 | 48 | 0 |
| C | 0 | 48 | 0 |
| D | 0 | 48 | 0 |
| Mode M0 | |||
|---|---|---|---|
| Quadrant | BADHDUFLAG | Total packets | Discarded packets |
| A | 0 | 87266 | 0 |
| B | 0 | 87920 | 0 |
| C | 0 | 86668 | 0 |
| D | 0 | 95747 | 0 |
| Quadrant | Total seconds | Saturated seconds | Saturation percentage |
|---|---|---|---|
| A | 41966 | 394 | 0.938855% |
| B | 41966 | 447 | 1.065148% |
| C | 41966 | 536 | 1.277224% |
| D | 41966 | 728 | 1.734738% |
Noise dominated data is calculated using 1-second bins in cleaned event files. If a bin has >2000 counts, and if more than 50% of those come from <1% of pixels, then it is considered to be noise-dominated and hence unusable.
| Quadrant | # 1 sec bins | Bins with >0 counts | Bins with >2000 counts | High rate bins dominated by noise | Noise dominated (total time) | Noise dominated (detector-on time) | Marked lightcurve |
|---|---|---|---|---|---|---|---|
| A | 46916 | 41965 | 1 | 1 | 0.00% | 0.00% |  |
| B | 46916 | 41964 | 0 | 0 | 0.00% | 0.00% |  |
| C | 46916 | 41963 | 2 | 2 | 0.00% | 0.00% | 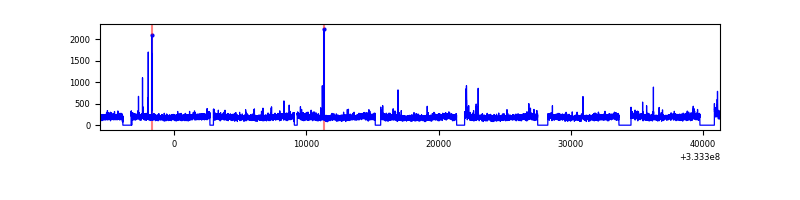 |
| D | 46916 | 41963 | 121 | 121 | 0.26% | 0.29% |  |
Top three noisy pixels from each quadrant. If the there are fewer than three noisy pixels in the level2.evt file, extra rows are filled as -1
| Pixel properties | Quadrant properties | ||||||
|---|---|---|---|---|---|---|---|
| Quadrant | DetID | PixID | Counts | Sigma | Mean | Median | Sigma |
| A | 0 | 13 | 329590 | 677.4 | 2208 | 2168 | 483.4 |
| A | 13 | 254 | 68932 | 138.13 | 2208 | 2168 | 483.4 |
| A | 6 | 16 | 17213 | 31.13 | 2208 | 2168 | 483.4 |
| B | 15 | 33 | 123344 | 286.32 | 2215 | 2161 | 423.2 |
| B | 0 | 190 | 101618 | 234.99 | 2215 | 2161 | 423.2 |
| B | 5 | 172 | 100055 | 231.29 | 2215 | 2161 | 423.2 |
| C | 3 | 233 | 91005 | 177.62 | 2105 | 2098 | 500.5 |
| C | 2 | 16 | 40958 | 77.64 | 2105 | 2098 | 500.5 |
| C | 14 | 225 | 25531 | 46.81 | 2105 | 2098 | 500.5 |
| D | 1 | 52 | 2224789 | 4344.24 | 2142 | 2078 | 511.6 |
| D | 12 | 233 | 359880 | 699.32 | 2142 | 2078 | 511.6 |
| D | 7 | 38 | 201112 | 389.01 | 2142 | 2078 | 511.6 |
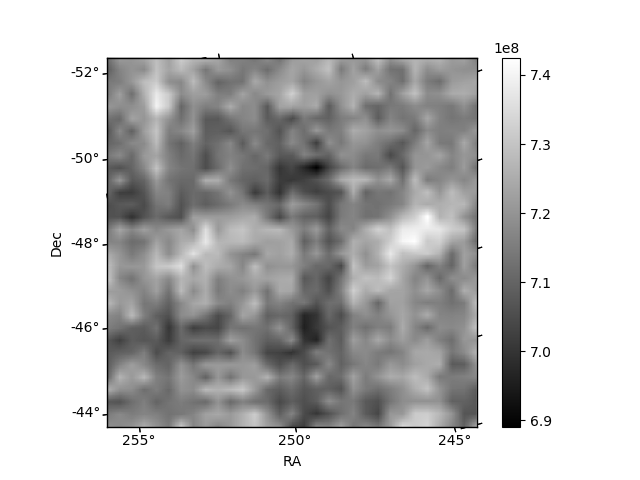
Histogram calculated using DETX and DETY for each event in the final _common_clean file
| Quadrant A |  |
 |
Quadrant B |
|---|---|---|---|
| Quadrant D |  |
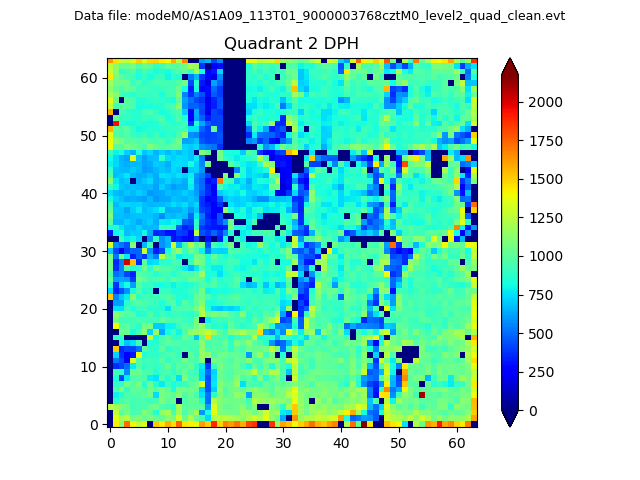 |
Quadrant C |
| Plot type | Count rate plots | Images |
|---|---|---|
| Comparison with Poisson distribution Blue bars denote a histogram of data divided into 1 sec bins. Red curve is a Poisson curve with rate = median count rate of data. |
 |
 |
| Quadrant-wise count rates Data is divided into 100 sec bins |
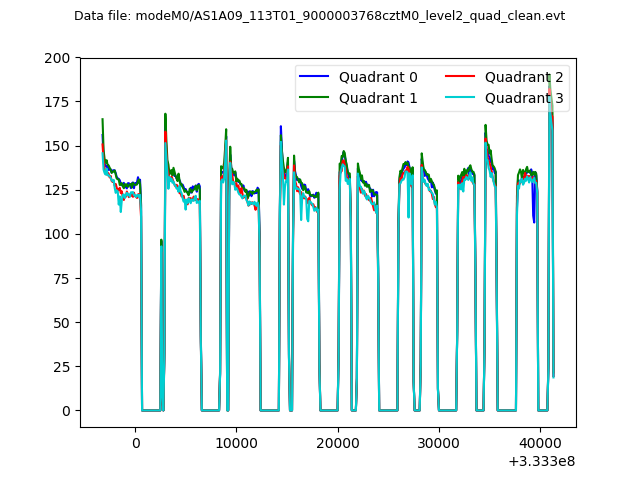 |
|
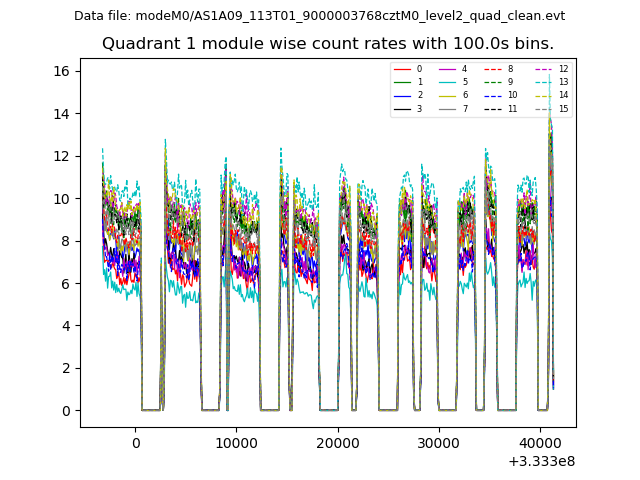
| Module-wise count rates for Quadrant A Data is divided into 100 sec bins |
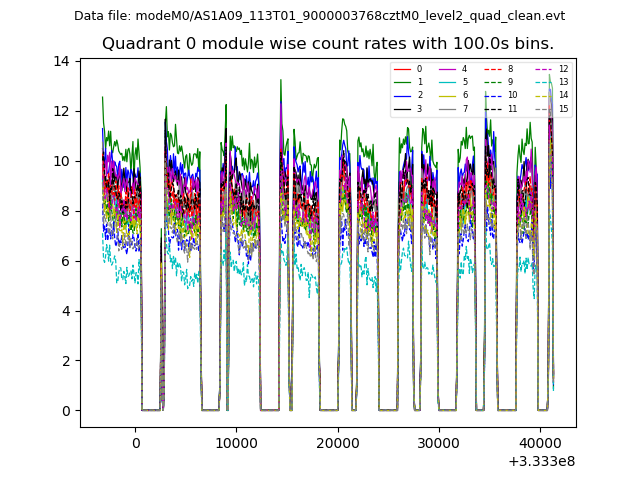 |
 |
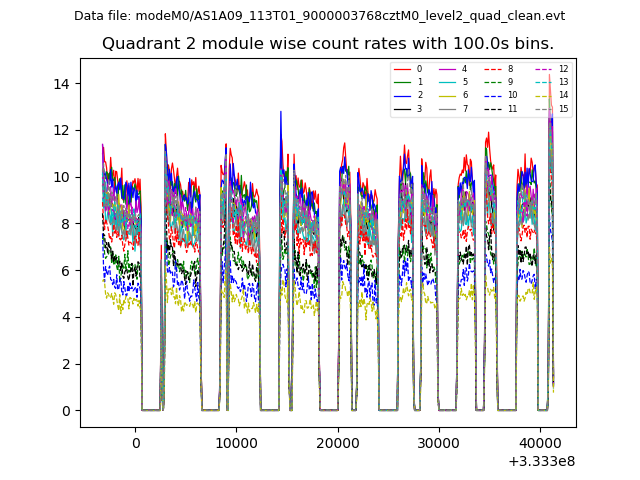
| Module-wise count rates for Quadrant B Data is divided into 100 sec bins |
 |
 |
| Module-wise count rates for Quadrant C Data is divided into 100 sec bins |
 |
 |
| Module-wise count rates for Quadrant D Data is divided into 100 sec bins |
 |
 |
| Parameter | Plot |
|---|---|
| CZT HV Monitor |  |
| D_VDD |  |
| Temperature 1 |  |
| Veto HV Monitor |  |
| Veto LLD | 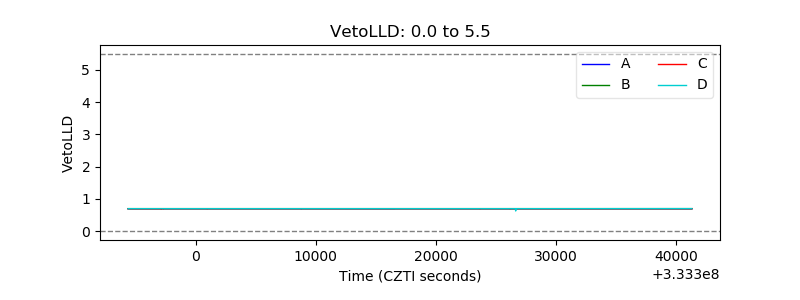 |
| Alpha Counter |  |
| _CPM_Rate | 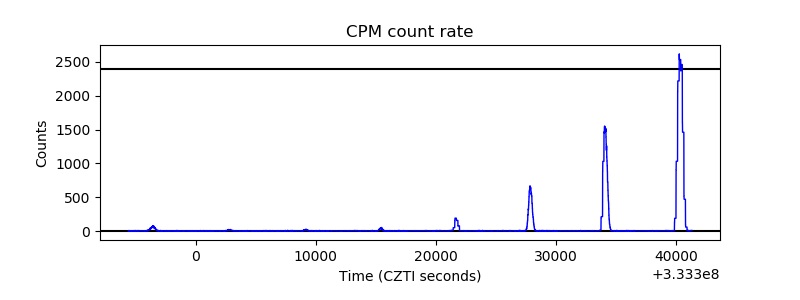 |
| CZT Counter |  |
| +2.5 Volts monitor |  |
| +5 Volts monitor |  |
| _ROLL_ROT |  |
| _Roll_DEC |  |
| _Roll_RA |  |
| Veto Counter |  |