| Param | Original file | Final file |
|---|---|---|
| Filename | modeM0/AS1A09_033T02_9000003762cztM0_level2_bc.evt | modeM0/AS1A09_033T02_9000003762cztM0_level2_quad_clean.evt |
| Size (bytes) | 3,595,564,800 | 1,307,145,600 |
| Size | 3.3 GB | 1.2 GB |
| Events in quadrant A | 23,976,415 | 8,383,061 |
| Events in quadrant B | 24,194,203 | 8,426,591 |
| Events in quadrant C | 20,974,945 | 8,019,626 |
| Events in quadrant D | 33,035,410 | 8,010,656 |
| Mode M9 | |||
|---|---|---|---|
| Quadrant | BADHDUFLAG | Total packets | Discarded packets |
| A | 0 | 173 | 0 |
| B | 0 | 173 | 0 |
| C | 0 | 173 | 0 |
| D | 0 | 173 | 0 |
| Mode SS | |||
|---|---|---|---|
| Quadrant | BADHDUFLAG | Total packets | Discarded packets |
| A | 0 | 2010 | 0 |
| B | 0 | 2010 | 0 |
| C | 0 | 2010 | 0 |
| D | 0 | 2010 | 0 |
| Mode M0 | |||
|---|---|---|---|
| Quadrant | BADHDUFLAG | Total packets | Discarded packets |
| A | 0 | 214004 | 0 |
| B | 0 | 215400 | 0 |
| C | 0 | 206437 | 0 |
| D | 0 | 240495 | 0 |
| Quadrant | Total seconds | Saturated seconds | Saturation percentage |
|---|---|---|---|
| A | 98531 | 1553 | 1.576154% |
| B | 98531 | 1891 | 1.919193% |
| C | 98530 | 1717 | 1.742616% |
| D | 98531 | 2731 | 2.771717% |
Noise dominated data is calculated using 1-second bins in cleaned event files. If a bin has >2000 counts, and if more than 50% of those come from <1% of pixels, then it is considered to be noise-dominated and hence unusable.
| Quadrant | # 1 sec bins | Bins with >0 counts | Bins with >2000 counts | High rate bins dominated by noise | Noise dominated (total time) | Noise dominated (detector-on time) | Marked lightcurve |
|---|---|---|---|---|---|---|---|
| A | 115710 | 98520 | 67 | 67 | 0.06% | 0.07% |  |
| B | 115710 | 98519 | 62 | 62 | 0.05% | 0.06% |  |
| C | 115710 | 98521 | 1 | 1 | 0.00% | 0.00% |  |
| D | 115710 | 98523 | 510 | 510 | 0.44% | 0.52% |  |
Top three noisy pixels from each quadrant. If the there are fewer than three noisy pixels in the level2.evt file, extra rows are filled as -1
| Pixel properties | Quadrant properties | ||||||
|---|---|---|---|---|---|---|---|
| Quadrant | DetID | PixID | Counts | Sigma | Mean | Median | Sigma |
| A | 0 | 13 | 2120628 | 1747.71 | 5668 | 5582 | 1210.2 |
| A | 13 | 254 | 131252 | 103.84 | 5668 | 5582 | 1210.2 |
| A | 0 | 226 | 36240 | 25.33 | 5668 | 5582 | 1210.2 |
| B | 10 | 245 | 1706033 | 1624.96 | 5642 | 5529 | 1046.5 |
| B | 0 | 229 | 473058 | 446.76 | 5642 | 5529 | 1046.5 |
| B | 0 | 190 | 254209 | 237.63 | 5642 | 5529 | 1046.5 |
| C | 3 | 233 | 336173 | 267.78 | 5350 | 5344 | 1235.4 |
| C | 2 | 16 | 39078 | 27.3 | 5350 | 5344 | 1235.4 |
| C | 13 | 61 | 30890 | 20.68 | 5350 | 5344 | 1235.4 |
| D | 1 | 52 | 9446662 | 7376.61 | 5493 | 5350 | 1279.9 |
| D | 7 | 223 | 979689 | 761.26 | 5493 | 5350 | 1279.9 |
| D | 7 | 80 | 495674 | 383.1 | 5493 | 5350 | 1279.9 |
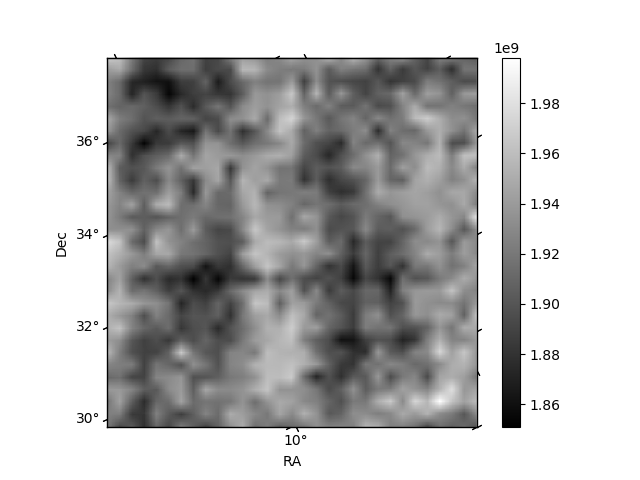
Histogram calculated using DETX and DETY for each event in the final _common_clean file
| Quadrant A |  |
 |
Quadrant B |
|---|---|---|---|
| Quadrant D |  |
 |
Quadrant C |
| Plot type | Count rate plots | Images |
|---|---|---|
| Comparison with Poisson distribution Blue bars denote a histogram of data divided into 1 sec bins. Red curve is a Poisson curve with rate = median count rate of data. |
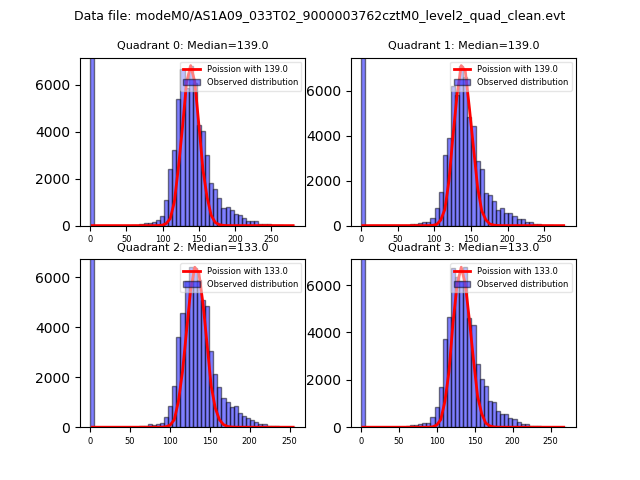 |
 |
| Quadrant-wise count rates Data is divided into 100 sec bins |
 |
|
| Module-wise count rates for Quadrant A Data is divided into 100 sec bins |
 |
 |
| Module-wise count rates for Quadrant B Data is divided into 100 sec bins |
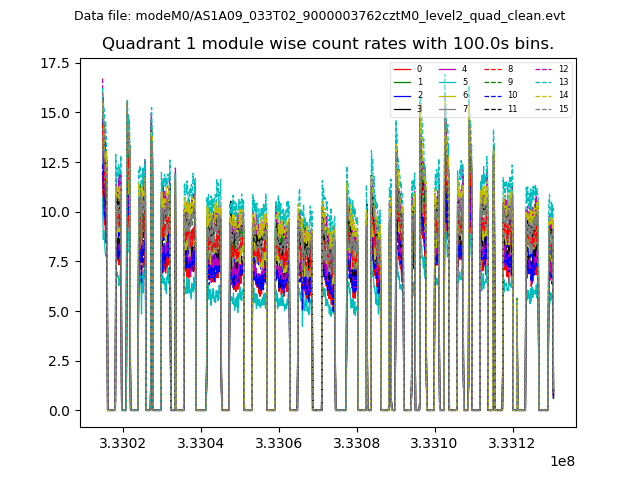 |
 |
| Module-wise count rates for Quadrant C Data is divided into 100 sec bins |
 |
 |
| Module-wise count rates for Quadrant D Data is divided into 100 sec bins |
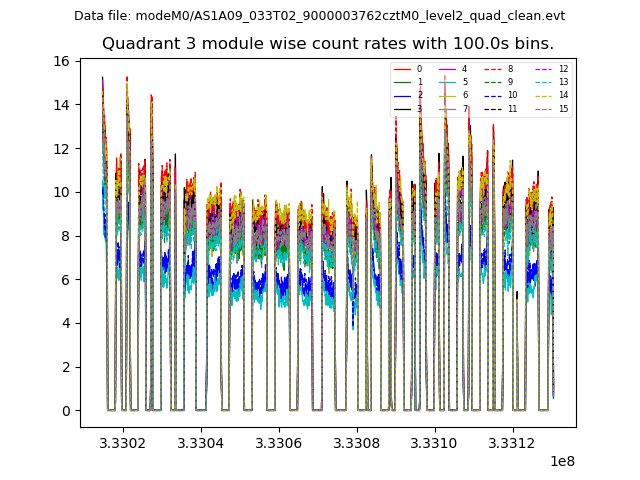 |
 |
| Parameter | Plot |
|---|---|
| CZT HV Monitor |  |
| D_VDD | 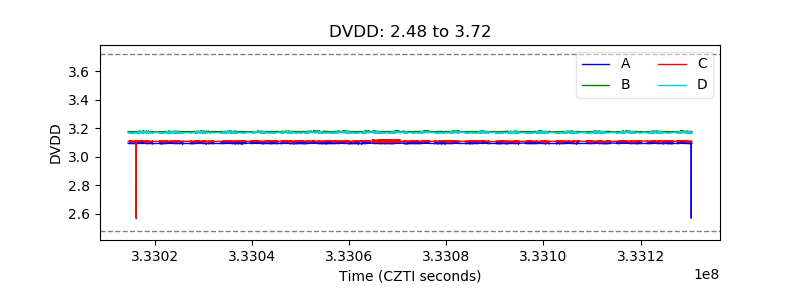 |
| Temperature 1 | 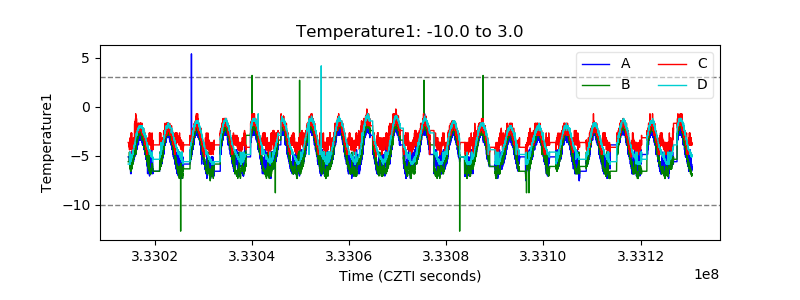 |
| Veto HV Monitor | 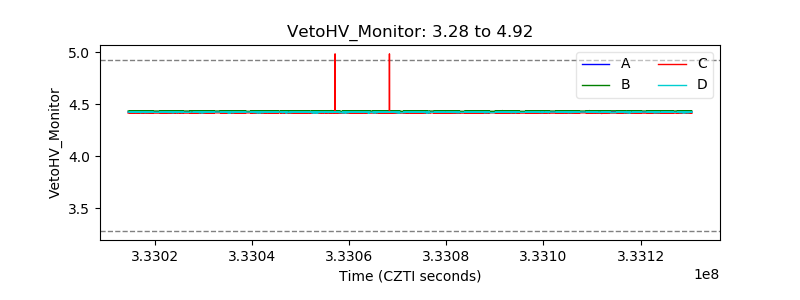 |
| Veto LLD |  |
| Alpha Counter |  |
| _CPM_Rate |  |
| CZT Counter |  |
| +2.5 Volts monitor | 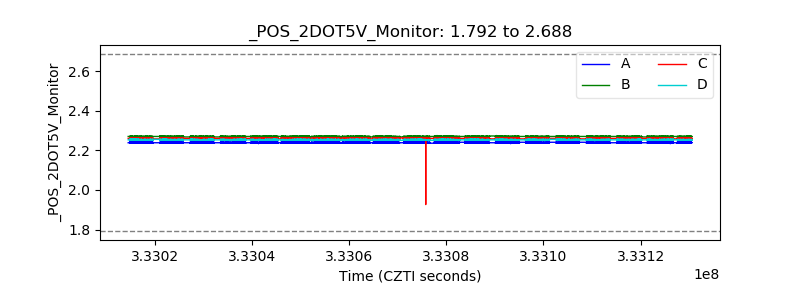 |
| +5 Volts monitor |  |
| _ROLL_ROT | 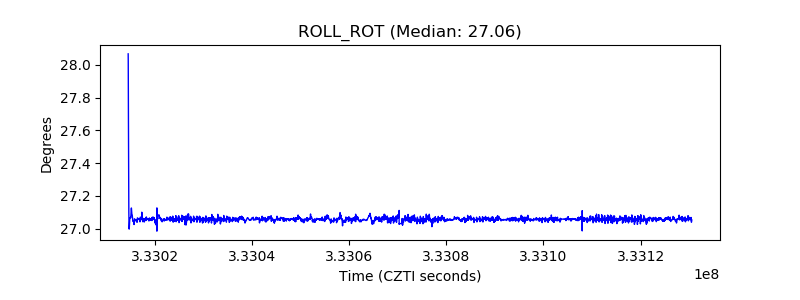 |
| _Roll_DEC |  |
| _Roll_RA |  |
| Veto Counter | 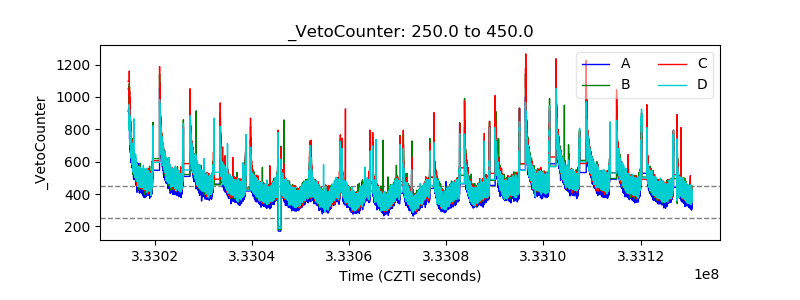 |