| Param | Original file | Final file |
|---|---|---|
| Filename | modeM0/AS1A07_068T01_9000003760cztM0_level2_bc.evt | modeM0/AS1A07_068T01_9000003760cztM0_level2_quad_clean.evt |
| Size (bytes) | 15,579,650,880 | 5,410,339,200 |
| Size | 14.5 GB | 5.0 GB |
| Events in quadrant A | 109,382,911 | 35,066,663 |
| Events in quadrant B | 86,210,596 | 35,919,707 |
| Events in quadrant C | 81,630,042 | 34,190,112 |
| Events in quadrant D | 169,011,037 | 32,931,925 |
| Mode M0 | |||
|---|---|---|---|
| Quadrant | BADHDUFLAG | Total packets | Discarded packets |
| A | 0 | 898904 | 0 |
| B | 0 | 804018 | 0 |
| C | 0 | 801372 | 0 |
| D | 0 | 1108754 | 0 |
| Mode SS | |||
|---|---|---|---|
| Quadrant | BADHDUFLAG | Total packets | Discarded packets |
| A | 0 | 8040 | 0 |
| B | 0 | 8040 | 0 |
| C | 0 | 8038 | 0 |
| D | 0 | 8040 | 0 |
| Mode M9 | |||
|---|---|---|---|
| Quadrant | BADHDUFLAG | Total packets | Discarded packets |
| A | 0 | 645 | 0 |
| B | 0 | 645 | 0 |
| C | 0 | 645 | 0 |
| D | 0 | 645 | 0 |
| Quadrant | Total seconds | Saturated seconds | Saturation percentage |
|---|---|---|---|
| A | 375025 | 17866 | 4.763949% |
| B | 374998 | 5284 | 1.409074% |
| C | 375050 | 6444 | 1.718171% |
| D | 374998 | 27405 | 7.308039% |
Noise dominated data is calculated using 1-second bins in cleaned event files. If a bin has >2000 counts, and if more than 50% of those come from <1% of pixels, then it is considered to be noise-dominated and hence unusable.
| Quadrant | # 1 sec bins | Bins with >0 counts | Bins with >2000 counts | High rate bins dominated by noise | Noise dominated (total time) | Noise dominated (detector-on time) | Marked lightcurve |
|---|---|---|---|---|---|---|---|
| A | 499203 | 375098 | 3566 | 3566 | 0.71% | 0.95% |  |
| B | 499204 | 375151 | 167 | 167 | 0.03% | 0.04% |  |
| C | 499204 | 375173 | 7 | 7 | 0.00% | 0.00% |  |
| D | 499204 | 375125 | 6401 | 6401 | 1.28% | 1.71% |  |
Top three noisy pixels from each quadrant. If the there are fewer than three noisy pixels in the level2.evt file, extra rows are filled as -1
| Pixel properties | Quadrant properties | ||||||
|---|---|---|---|---|---|---|---|
| Quadrant | DetID | PixID | Counts | Sigma | Mean | Median | Sigma |
| A | 0 | 13 | 27480343 | 6169.11 | 20820 | 20545 | 4451.2 |
| A | 15 | 169 | 1033101 | 227.48 | 20820 | 20545 | 4451.2 |
| A | 13 | 254 | 514479 | 110.97 | 20820 | 20545 | 4451.2 |
| B | 10 | 245 | 2398862 | 599.96 | 21127 | 20674 | 3963.9 |
| B | 0 | 190 | 1362274 | 338.46 | 21127 | 20674 | 3963.9 |
| B | 0 | 229 | 583778 | 142.06 | 21127 | 20674 | 3963.9 |
| C | 3 | 233 | 3397910 | 725.01 | 20026 | 19992 | 4659.1 |
| C | 0 | 239 | 538604 | 111.31 | 20026 | 19992 | 4659.1 |
| C | 0 | 207 | 480263 | 98.79 | 20026 | 19992 | 4659.1 |
| D | 1 | 52 | 73930082 | 16040.07 | 20087 | 19594 | 4607.9 |
| D | 12 | 2 | 4929511 | 1065.55 | 20087 | 19594 | 4607.9 |
| D | 12 | 233 | 4311937 | 931.53 | 20087 | 19594 | 4607.9 |
Histogram calculated using DETX and DETY for each event in the final _common_clean file
| Quadrant A | 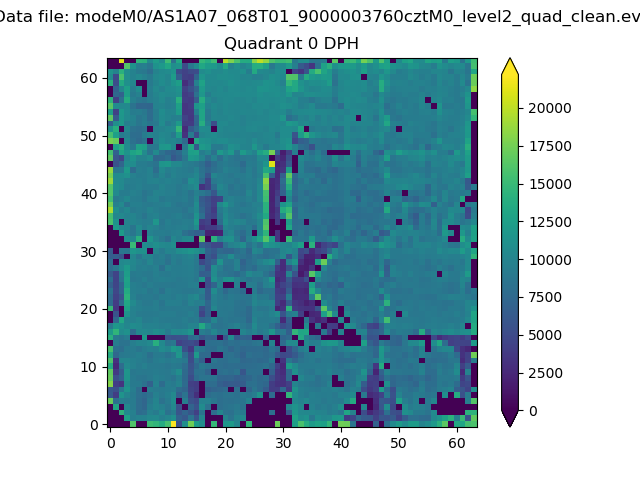 |
 |
Quadrant B |
|---|---|---|---|
| Quadrant D |  |
 |
Quadrant C |
| Plot type | Count rate plots | Images |
|---|---|---|
| Comparison with Poisson distribution Blue bars denote a histogram of data divided into 1 sec bins. Red curve is a Poisson curve with rate = median count rate of data. |
 |
 |
| Quadrant-wise count rates Data is divided into 100 sec bins |
 |
|
| Module-wise count rates for Quadrant A Data is divided into 100 sec bins |
 |
 |
| Module-wise count rates for Quadrant B Data is divided into 100 sec bins |
 |
 |
| Module-wise count rates for Quadrant C Data is divided into 100 sec bins |
 |
 |
| Module-wise count rates for Quadrant D Data is divided into 100 sec bins |
 |
 |
| Parameter | Plot |
|---|---|
| CZT HV Monitor | 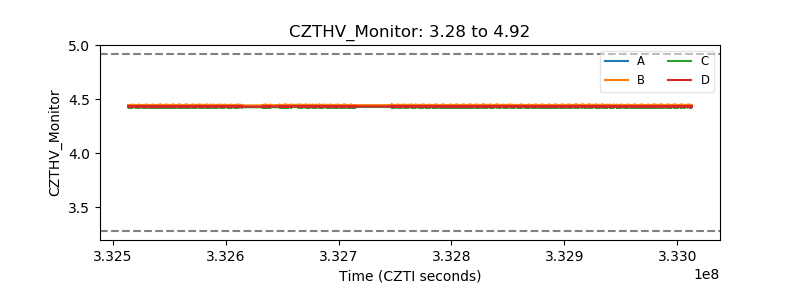 |
| D_VDD |  |
| Temperature 1 |  |
| Veto HV Monitor |  |
| Veto LLD |  |
| Alpha Counter | 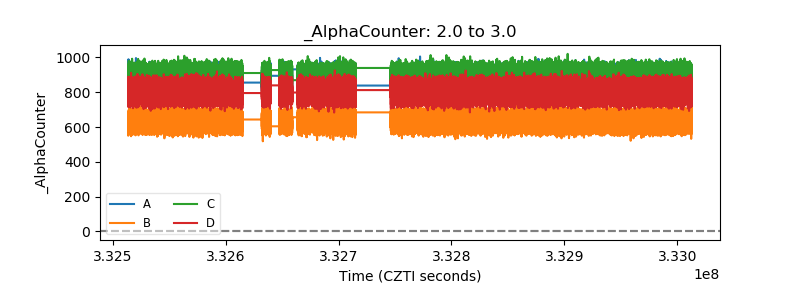 |
| _CPM_Rate |  |
| CZT Counter | 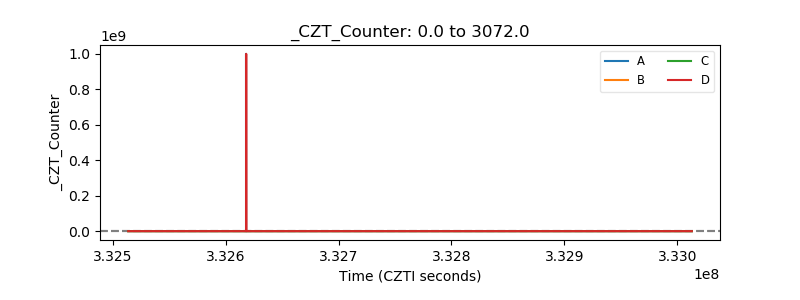 |
| +2.5 Volts monitor |  |
| +5 Volts monitor |  |
| _ROLL_ROT |  |
| _Roll_DEC |  |
| _Roll_RA |  |
| Veto Counter |  |