| Param | Original file | Final file |
|---|---|---|
| Filename | modeM0/AS1A07_068T01_9000003756cztM0_level2_bc.evt | modeM0/AS1A07_068T01_9000003756cztM0_level2_quad_clean.evt |
| Size (bytes) | 28,455,716,160 | 8,390,810,880 |
| Size | 26.5 GB | 7.8 GB |
| Events in quadrant A | 246,918,121 | 53,663,658 |
| Events in quadrant B | 141,594,441 | 55,466,588 |
| Events in quadrant C | 181,551,302 | 51,546,691 |
| Events in quadrant D | 249,860,537 | 51,292,545 |
| Mode M0 | |||
|---|---|---|---|
| Quadrant | BADHDUFLAG | Total packets | Discarded packets |
| A | 0 | 1663331 | 0 |
| B | 0 | 1320485 | 0 |
| C | 0 | 1468463 | 0 |
| D | 0 | 1671056 | 0 |
| Mode SS | |||
|---|---|---|---|
| Quadrant | BADHDUFLAG | Total packets | Discarded packets |
| A | 0 | 12536 | 0 |
| B | 0 | 12536 | 0 |
| C | 0 | 12536 | 0 |
| D | 0 | 12538 | 0 |
| Mode M9 | |||
|---|---|---|---|
| Quadrant | BADHDUFLAG | Total packets | Discarded packets |
| A | 0 | 1055 | 0 |
| B | 0 | 1055 | 0 |
| C | 0 | 1055 | 0 |
| D | 0 | 1055 | 0 |
| Quadrant | Total seconds | Saturated seconds | Saturation percentage |
|---|---|---|---|
| A | 616005 | 41273 | 6.700108% |
| B | 616021 | 8950 | 1.452873% |
| C | 616015 | 29812 | 4.839493% |
| D | 616015 | 32274 | 5.239158% |
Noise dominated data is calculated using 1-second bins in cleaned event files. If a bin has >2000 counts, and if more than 50% of those come from <1% of pixels, then it is considered to be noise-dominated and hence unusable.
| Quadrant | # 1 sec bins | Bins with >0 counts | Bins with >2000 counts | High rate bins dominated by noise | Noise dominated (total time) | Noise dominated (detector-on time) | Marked lightcurve |
|---|---|---|---|---|---|---|---|
| A | 737957 | 616006 | 13525 | 13525 | 1.83% | 2.20% |  |
| B | 737957 | 616030 | 188 | 188 | 0.03% | 0.03% |  |
| C | 737957 | 616033 | 10279 | 10279 | 1.39% | 1.67% |  |
| D | 737957 | 616019 | 11680 | 11680 | 1.58% | 1.90% | 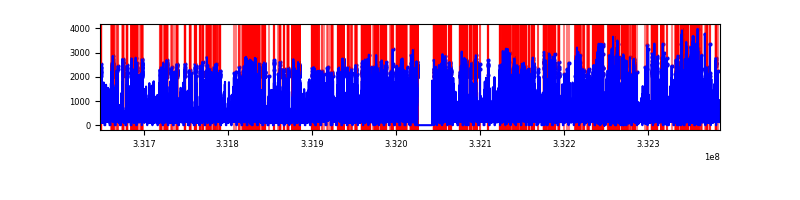 |
Top three noisy pixels from each quadrant. If the there are fewer than three noisy pixels in the level2.evt file, extra rows are filled as -1
| Pixel properties | Quadrant properties | ||||||
|---|---|---|---|---|---|---|---|
| Quadrant | DetID | PixID | Counts | Sigma | Mean | Median | Sigma |
| A | 0 | 13 | 116630075 | 16428.83 | 33206 | 32725 | 7097.1 |
| A | 6 | 16 | 1783889 | 246.74 | 33206 | 32725 | 7097.1 |
| A | 13 | 254 | 817624 | 110.59 | 33206 | 32725 | 7097.1 |
| B | 10 | 245 | 6025373 | 940.58 | 33901 | 33113 | 6370.8 |
| B | 0 | 219 | 2283284 | 353.2 | 33901 | 33113 | 6370.8 |
| B | 0 | 190 | 852187 | 128.57 | 33901 | 33113 | 6370.8 |
| C | 7 | 87 | 49736580 | 6770.49 | 31477 | 31369 | 7341.4 |
| C | 3 | 233 | 9424076 | 1279.41 | 31477 | 31369 | 7341.4 |
| C | 14 | 225 | 484881 | 61.77 | 31477 | 31369 | 7341.4 |
| D | 1 | 52 | 64294529 | 8689.97 | 32183 | 31291 | 7395.1 |
| D | 7 | 80 | 26929148 | 3637.25 | 32183 | 31291 | 7395.1 |
| D | 7 | 223 | 12841740 | 1732.29 | 32183 | 31291 | 7395.1 |
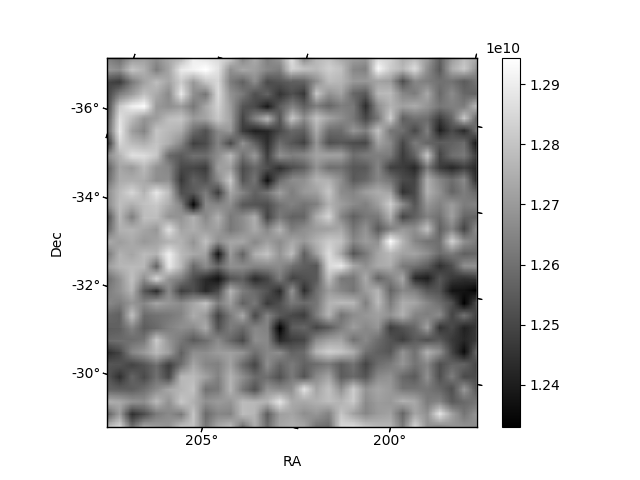
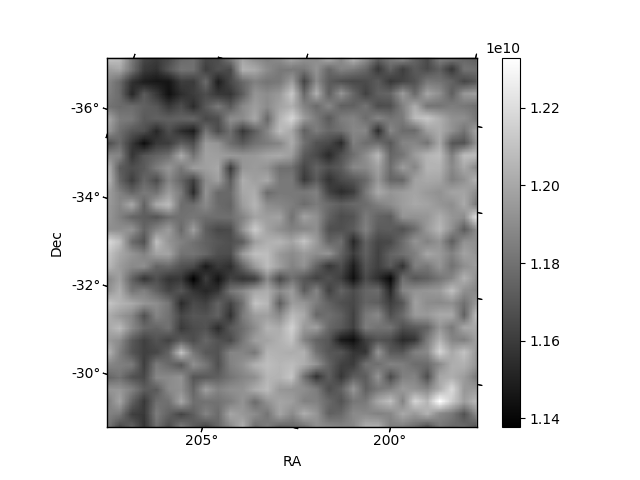
Histogram calculated using DETX and DETY for each event in the final _common_clean file
| Quadrant A | 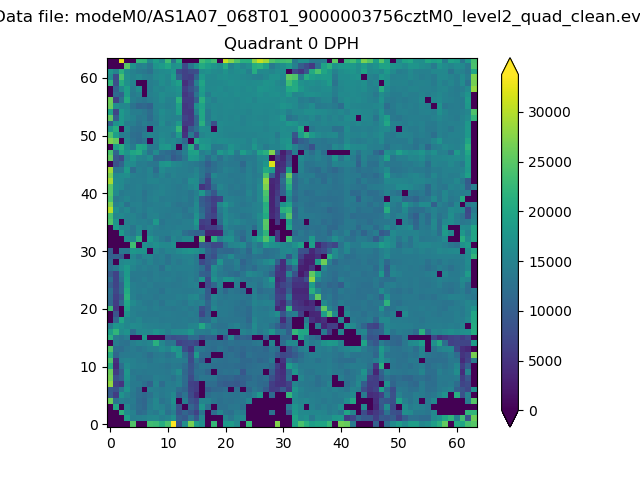 |
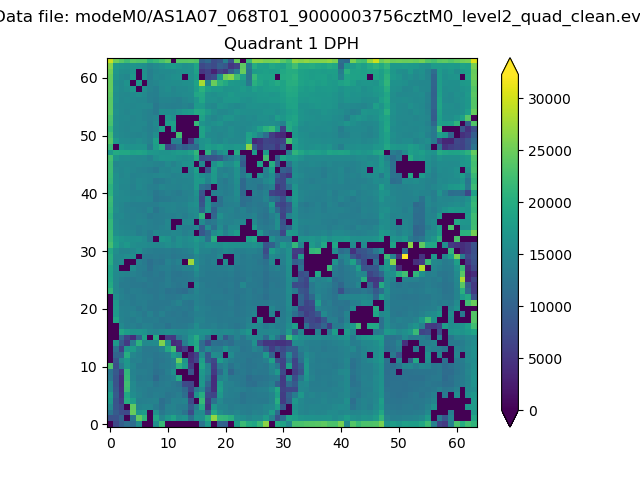 |
Quadrant B |
|---|---|---|---|
| Quadrant D |  |
 |
Quadrant C |
| Plot type | Count rate plots | Images |
|---|---|---|
| Comparison with Poisson distribution Blue bars denote a histogram of data divided into 1 sec bins. Red curve is a Poisson curve with rate = median count rate of data. |
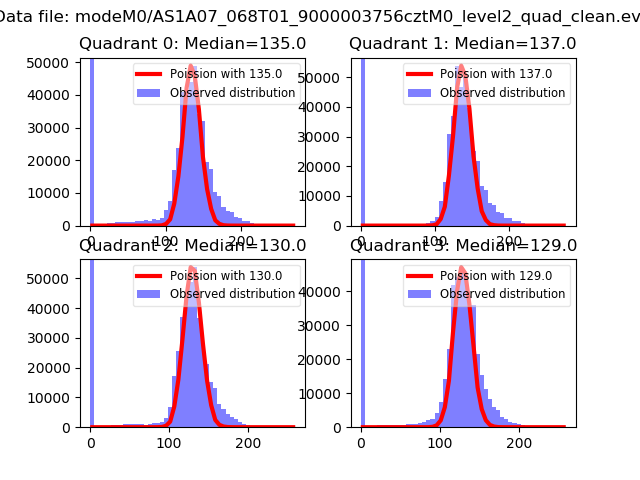 |
 |
| Quadrant-wise count rates Data is divided into 100 sec bins |
 |
|
| Module-wise count rates for Quadrant A Data is divided into 100 sec bins |
 |
 |
| Module-wise count rates for Quadrant B Data is divided into 100 sec bins |
 |
 |
| Module-wise count rates for Quadrant C Data is divided into 100 sec bins |
 |
 |
| Module-wise count rates for Quadrant D Data is divided into 100 sec bins |
 |
 |
| Parameter | Plot |
|---|---|
| CZT HV Monitor |  |
| D_VDD |  |
| Temperature 1 |  |
| Veto HV Monitor |  |
| Veto LLD |  |
| Alpha Counter | 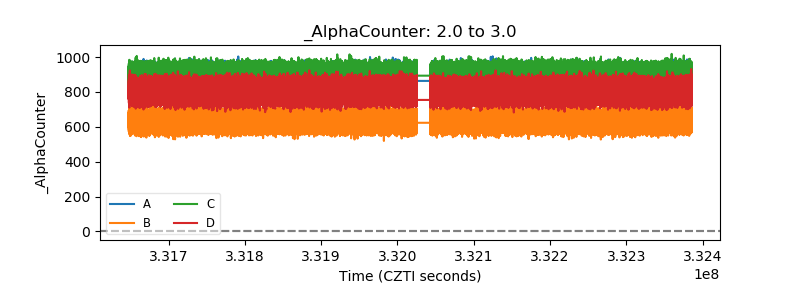 |
| _CPM_Rate |  |
| CZT Counter |  |
| +2.5 Volts monitor | 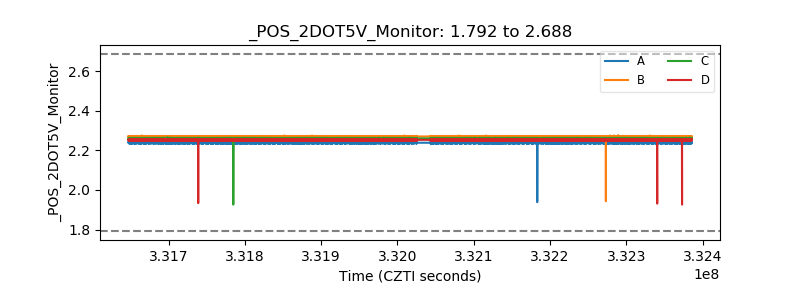 |
| +5 Volts monitor | 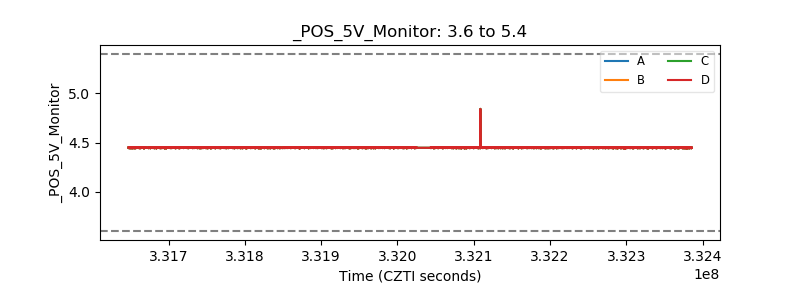 |
| _ROLL_ROT |  |
| _Roll_DEC |  |
| _Roll_RA | 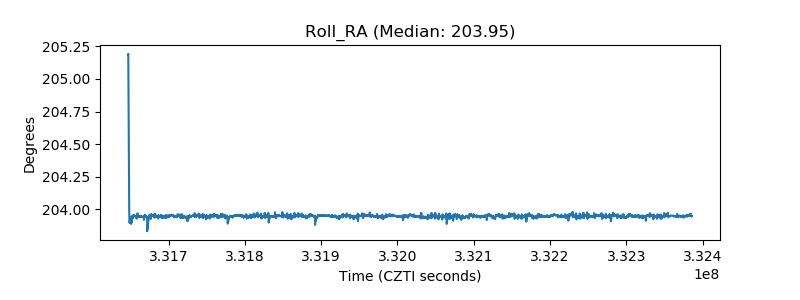 |
| Veto Counter |  |