| Param | Original file | Final file |
|---|---|---|
| Filename | modeM0/AS1A09_147T01_9000003754cztM0_level2_bc.evt | modeM0/AS1A09_147T01_9000003754cztM0_level2_quad_clean.evt |
| Size (bytes) | 6,331,847,040 | 2,173,083,840 |
| Size | 5.9 GB | 2.0 GB |
| Events in quadrant A | 37,490,313 | 14,160,575 |
| Events in quadrant B | 34,176,723 | 14,456,510 |
| Events in quadrant C | 32,523,263 | 13,778,521 |
| Events in quadrant D | 77,180,342 | 12,964,609 |
| Mode M9 | |||
|---|---|---|---|
| Quadrant | BADHDUFLAG | Total packets | Discarded packets |
| A | 0 | 248 | 0 |
| B | 0 | 248 | 0 |
| C | 0 | 248 | 0 |
| D | 0 | 248 | 0 |
| Mode SS | |||
|---|---|---|---|
| Quadrant | BADHDUFLAG | Total packets | Discarded packets |
| A | 0 | 3112 | 0 |
| B | 0 | 3112 | 0 |
| C | 0 | 3112 | 0 |
| D | 0 | 3112 | 0 |
| Mode M0 | |||
|---|---|---|---|
| Quadrant | BADHDUFLAG | Total packets | Discarded packets |
| A | 0 | 332520 | 0 |
| B | 0 | 322438 | 0 |
| C | 0 | 320417 | 0 |
| D | 0 | 482193 | 0 |
| Quadrant | Total seconds | Saturated seconds | Saturation percentage |
|---|---|---|---|
| A | 152680 | 2438 | 1.596804% |
| B | 152680 | 2300 | 1.506419% |
| C | 152680 | 2736 | 1.791983% |
| D | 152679 | 14450 | 9.464301% |
Noise dominated data is calculated using 1-second bins in cleaned event files. If a bin has >2000 counts, and if more than 50% of those come from <1% of pixels, then it is considered to be noise-dominated and hence unusable.
| Quadrant | # 1 sec bins | Bins with >0 counts | Bins with >2000 counts | High rate bins dominated by noise | Noise dominated (total time) | Noise dominated (detector-on time) | Marked lightcurve |
|---|---|---|---|---|---|---|---|
| A | 177044 | 152660 | 239 | 239 | 0.13% | 0.16% | 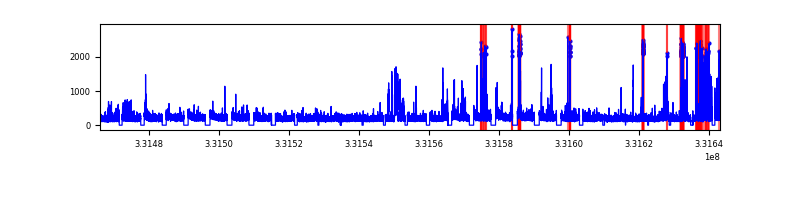 |
| B | 177044 | 152661 | 14 | 14 | 0.01% | 0.01% |  |
| C | 177044 | 152660 | 2 | 2 | 0.00% | 0.00% | 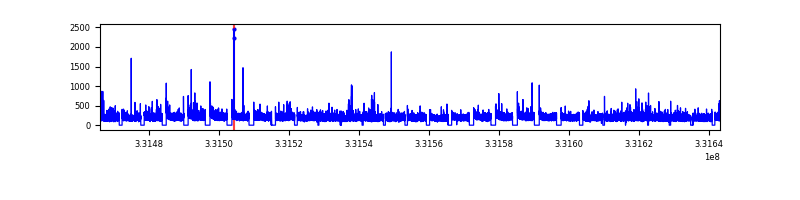 |
| D | 177043 | 152654 | 2177 | 2177 | 1.23% | 1.43% | 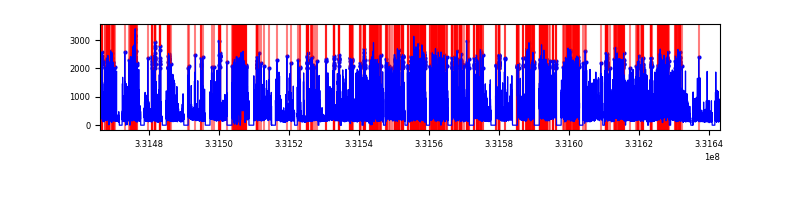 |
Top three noisy pixels from each quadrant. If the there are fewer than three noisy pixels in the level2.evt file, extra rows are filled as -1
| Pixel properties | Quadrant properties | ||||||
|---|---|---|---|---|---|---|---|
| Quadrant | DetID | PixID | Counts | Sigma | Mean | Median | Sigma |
| A | 0 | 13 | 3602714 | 1981.14 | 8459 | 8339 | 1814.3 |
| A | 11 | 29 | 943790 | 515.6 | 8459 | 8339 | 1814.3 |
| A | 6 | 16 | 261458 | 139.51 | 8459 | 8339 | 1814.3 |
| B | 0 | 190 | 353071 | 217.14 | 8561 | 8379 | 1587.4 |
| B | 0 | 219 | 248055 | 150.98 | 8561 | 8379 | 1587.4 |
| B | 0 | 229 | 191415 | 115.3 | 8561 | 8379 | 1587.4 |
| C | 3 | 233 | 1065977 | 552.74 | 8168 | 8168 | 1913.8 |
| C | 13 | 61 | 46651 | 20.11 | 8168 | 8168 | 1913.8 |
| C | 15 | 127 | 31450 | 12.17 | 8168 | 8168 | 1913.8 |
| D | 1 | 52 | 17632750 | 9609.55 | 7946 | 7750 | 1834.1 |
| D | 7 | 80 | 13671519 | 7449.8 | 7946 | 7750 | 1834.1 |
| D | 12 | 2 | 6255456 | 3406.39 | 7946 | 7750 | 1834.1 |
Histogram calculated using DETX and DETY for each event in the final _common_clean file
| Quadrant A | 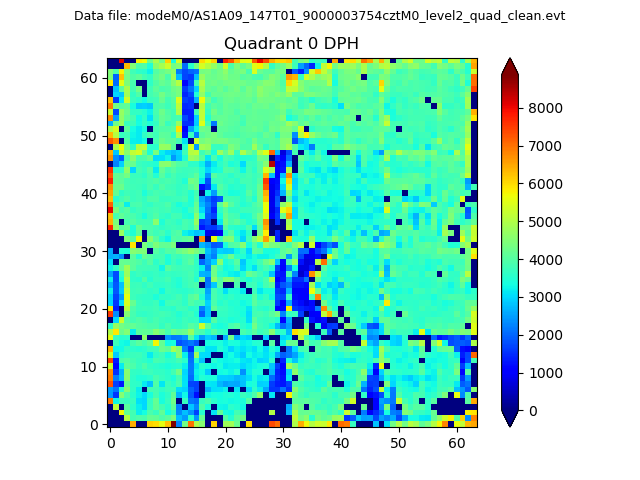 |
 |
Quadrant B |
|---|---|---|---|
| Quadrant D |  |
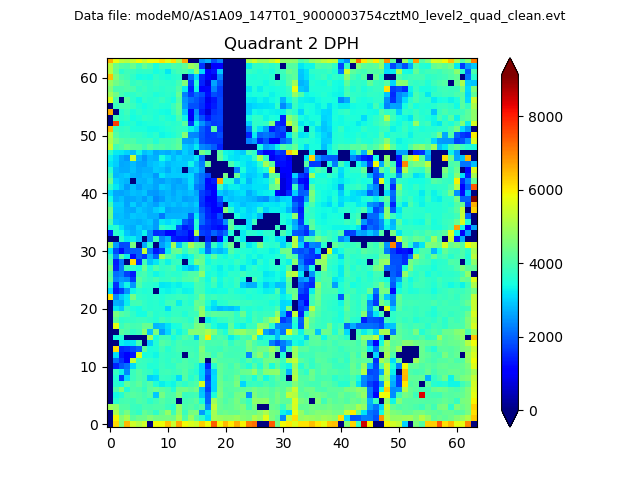 |
Quadrant C |
| Plot type | Count rate plots | Images |
|---|---|---|
| Comparison with Poisson distribution Blue bars denote a histogram of data divided into 1 sec bins. Red curve is a Poisson curve with rate = median count rate of data. |
 |
 |
| Quadrant-wise count rates Data is divided into 100 sec bins |
 |
|
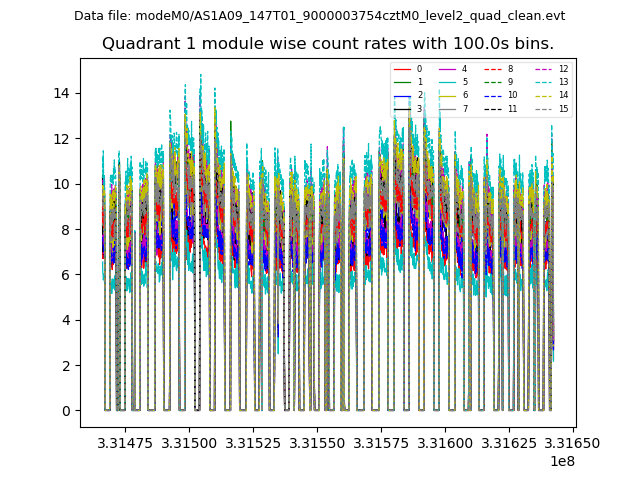
| Module-wise count rates for Quadrant A Data is divided into 100 sec bins |
 |
 |
| Module-wise count rates for Quadrant B Data is divided into 100 sec bins |
 |
 |
| Module-wise count rates for Quadrant C Data is divided into 100 sec bins |
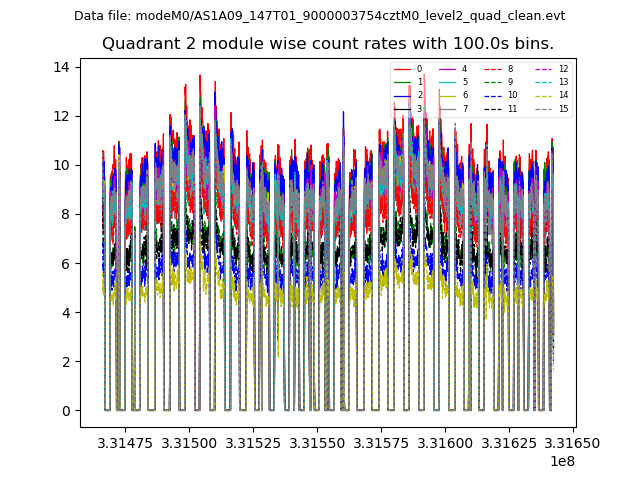 |
 |
| Module-wise count rates for Quadrant D Data is divided into 100 sec bins |
 |
 |
| Parameter | Plot |
|---|---|
| CZT HV Monitor |  |
| D_VDD | 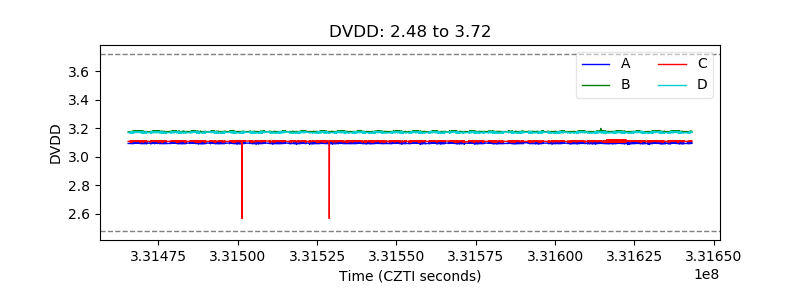 |
| Temperature 1 | 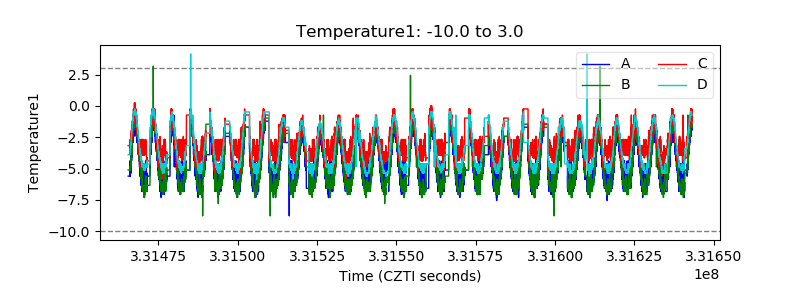 |
| Veto HV Monitor |  |
| Veto LLD |  |
| Alpha Counter |  |
| _CPM_Rate |  |
| CZT Counter |  |
| +2.5 Volts monitor |  |
| +5 Volts monitor |  |
| _ROLL_ROT | 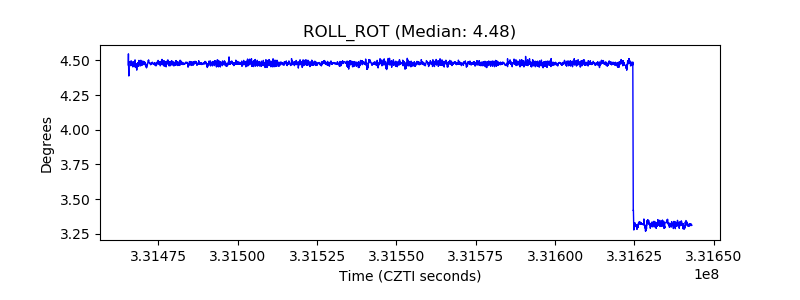 |
| _Roll_DEC | 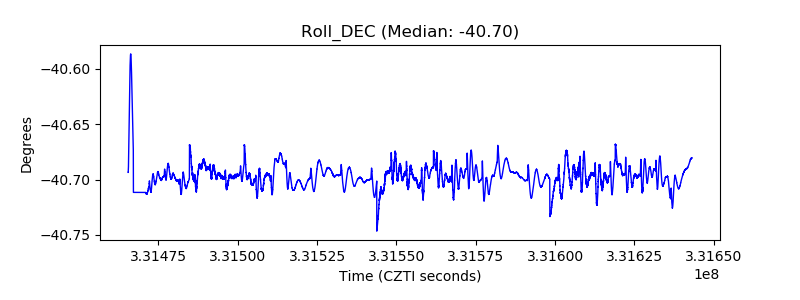 |
| _Roll_RA | 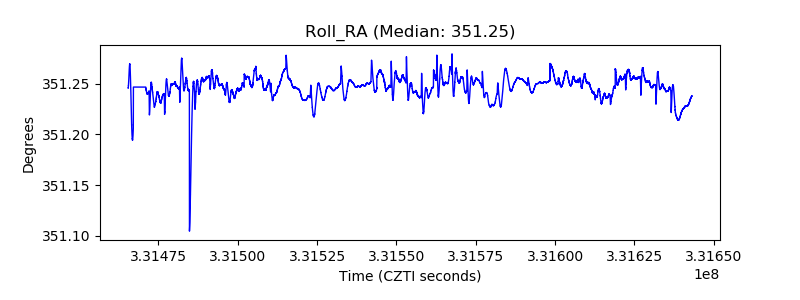 |
| Veto Counter | 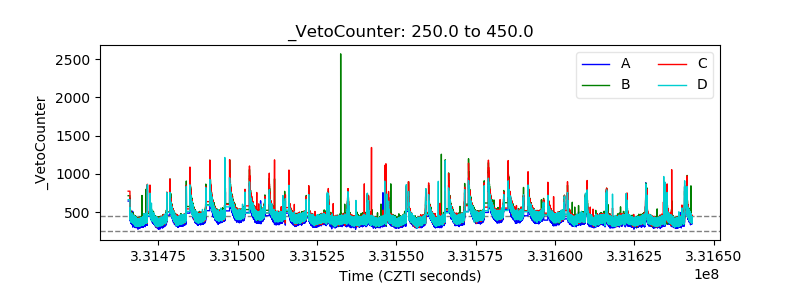 |