| Param | Original file | Final file |
|---|---|---|
| Filename | modeM0/AS1A07_027T11_9000003752cztM0_level2_bc.evt | modeM0/AS1A07_027T11_9000003752cztM0_level2_quad_clean.evt |
| Size (bytes) | 831,634,560 | 321,482,880 |
| Size | 793.1 MB | 306.6 MB |
| Events in quadrant A | 5,031,182 | 2,053,143 |
| Events in quadrant B | 5,132,568 | 2,083,407 |
| Events in quadrant C | 5,141,148 | 1,993,286 |
| Events in quadrant D | 8,224,797 | 1,942,090 |
| Mode M0 | |||
|---|---|---|---|
| Quadrant | BADHDUFLAG | Total packets | Discarded packets |
| A | 0 | 50343 | 0 |
| B | 0 | 50429 | 0 |
| C | 0 | 51106 | 0 |
| D | 0 | 60126 | 0 |
| Mode M9 | |||
|---|---|---|---|
| Quadrant | BADHDUFLAG | Total packets | Discarded packets |
| A | 0 | 12 | 0 |
| B | 0 | 12 | 0 |
| C | 0 | 12 | 0 |
| D | 0 | 12 | 0 |
| Mode SS | |||
|---|---|---|---|
| Quadrant | BADHDUFLAG | Total packets | Discarded packets |
| A | 0 | 490 | 0 |
| B | 0 | 490 | 0 |
| C | 0 | 490 | 0 |
| D | 0 | 490 | 0 |
| Quadrant | Total seconds | Saturated seconds | Saturation percentage |
|---|---|---|---|
| A | 24207 | 645 | 2.664519% |
| B | 24207 | 729 | 3.011526% |
| C | 24206 | 737 | 3.044700% |
| D | 24207 | 974 | 4.023630% |
Noise dominated data is calculated using 1-second bins in cleaned event files. If a bin has >2000 counts, and if more than 50% of those come from <1% of pixels, then it is considered to be noise-dominated and hence unusable.
| Quadrant | # 1 sec bins | Bins with >0 counts | Bins with >2000 counts | High rate bins dominated by noise | Noise dominated (total time) | Noise dominated (detector-on time) | Marked lightcurve |
|---|---|---|---|---|---|---|---|
| A | 25457 | 24205 | 0 | 0 | 0.00% | 0.00% |  |
| B | 25457 | 24204 | 0 | 0 | 0.00% | 0.00% |  |
| C | 25457 | 24203 | 4 | 4 | 0.02% | 0.02% |  |
| D | 25457 | 24204 | 56 | 56 | 0.22% | 0.23% |  |
Top three noisy pixels from each quadrant. If the there are fewer than three noisy pixels in the level2.evt file, extra rows are filled as -1
| Pixel properties | Quadrant properties | ||||||
|---|---|---|---|---|---|---|---|
| Quadrant | DetID | PixID | Counts | Sigma | Mean | Median | Sigma |
| A | 6 | 16 | 166247 | 606.06 | 1246 | 1219 | 272.3 |
| A | 11 | 29 | 51608 | 185.05 | 1246 | 1219 | 272.3 |
| A | 13 | 254 | 33565 | 118.79 | 1246 | 1219 | 272.3 |
| B | 0 | 219 | 99721 | 408.01 | 1259 | 1227 | 241.4 |
| B | 0 | 245 | 69984 | 284.82 | 1259 | 1227 | 241.4 |
| B | 0 | 190 | 66108 | 268.77 | 1259 | 1227 | 241.4 |
| C | 3 | 233 | 460443 | 1606.85 | 1210 | 1202 | 285.8 |
| C | 14 | 225 | 23544 | 78.17 | 1210 | 1202 | 285.8 |
| C | 2 | 16 | 8469 | 25.43 | 1210 | 1202 | 285.8 |
| D | 8 | 195 | 1089684 | 3792.18 | 1219 | 1181 | 287.0 |
| D | 1 | 52 | 770418 | 2679.91 | 1219 | 1181 | 287.0 |
| D | 12 | 1 | 653675 | 2273.19 | 1219 | 1181 | 287.0 |
Histogram calculated using DETX and DETY for each event in the final _common_clean file
| Quadrant A |  |
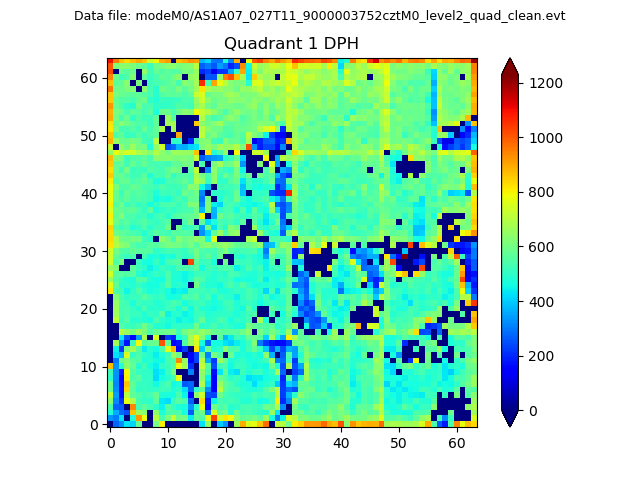 |
Quadrant B |
|---|---|---|---|
| Quadrant D |  |
 |
Quadrant C |
| Plot type | Count rate plots | Images |
|---|---|---|
| Comparison with Poisson distribution Blue bars denote a histogram of data divided into 1 sec bins. Red curve is a Poisson curve with rate = median count rate of data. |
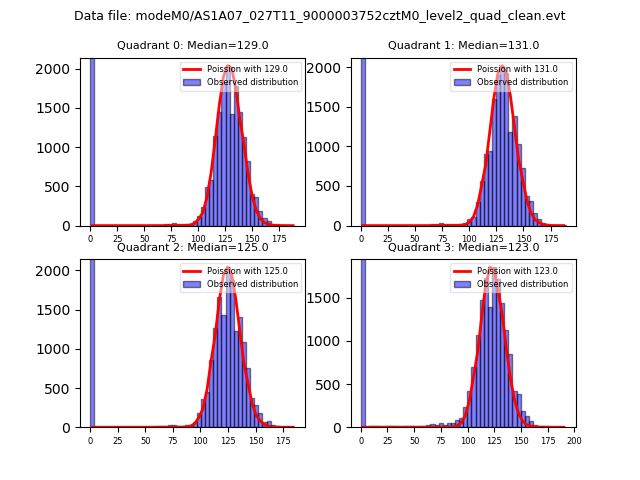 |
 |
| Quadrant-wise count rates Data is divided into 100 sec bins |
 |
|
| Module-wise count rates for Quadrant A Data is divided into 100 sec bins |
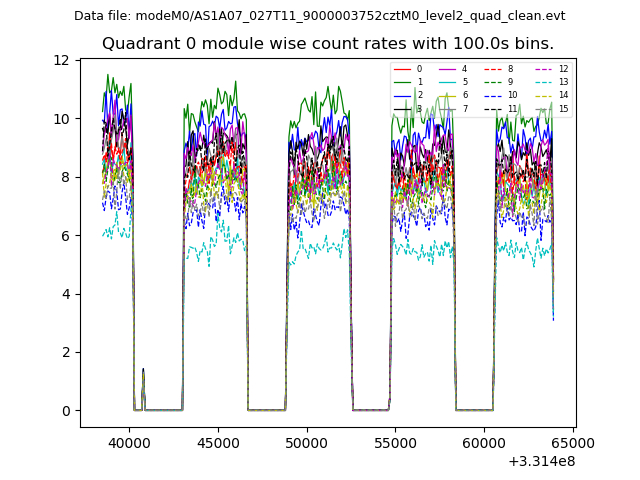 |
 |
| Module-wise count rates for Quadrant B Data is divided into 100 sec bins |
 |
 |
| Module-wise count rates for Quadrant C Data is divided into 100 sec bins |
 |
 |
| Module-wise count rates for Quadrant D Data is divided into 100 sec bins |
 |
 |
| Parameter | Plot |
|---|---|
| CZT HV Monitor |  |
| D_VDD |  |
| Temperature 1 |  |
| Veto HV Monitor |  |
| Veto LLD |  |
| Alpha Counter |  |
| _CPM_Rate |  |
| CZT Counter |  |
| +2.5 Volts monitor |  |
| +5 Volts monitor |  |
| _ROLL_ROT | 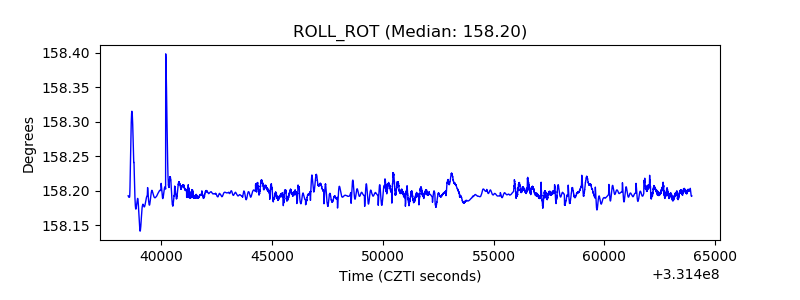 |
| _Roll_DEC |  |
| _Roll_RA |  |
| Veto Counter |  |