| Param | Original file | Final file |
|---|---|---|
| Filename | modeM0/AS1A09_008T06_9000003748cztM0_level2_bc.evt | modeM0/AS1A09_008T06_9000003748cztM0_level2_quad_clean.evt |
| Size (bytes) | 227,044,800 | 90,627,840 |
| Size | 216.5 MB | 86.4 MB |
| Events in quadrant A | 1,281,760 | 591,313 |
| Events in quadrant B | 1,404,656 | 612,039 |
| Events in quadrant C | 1,301,931 | 589,799 |
| Events in quadrant D | 2,505,020 | 566,058 |
| Mode M0 | |||
|---|---|---|---|
| Quadrant | BADHDUFLAG | Total packets | Discarded packets |
| A | 0 | 11896 | 0 |
| B | 0 | 12480 | 0 |
| C | 0 | 12350 | 0 |
| D | 0 | 15803 | 0 |
| Mode SS | |||
|---|---|---|---|
| Quadrant | BADHDUFLAG | Total packets | Discarded packets |
| A | 0 | 114 | 0 |
| B | 0 | 114 | 0 |
| C | 0 | 114 | 0 |
| D | 0 | 114 | 0 |
| Mode M9 | |||
|---|---|---|---|
| Quadrant | BADHDUFLAG | Total packets | Discarded packets |
| A | 0 | 19 | 0 |
| B | 0 | 20 | 0 |
| C | 0 | 20 | 0 |
| D | 0 | 20 | 0 |
| Quadrant | Total seconds | Saturated seconds | Saturation percentage |
|---|---|---|---|
| A | 5502 | 43 | 0.781534% |
| B | 5502 | 88 | 1.599418% |
| C | 5502 | 116 | 2.108324% |
| D | 5502 | 284 | 5.161759% |
Noise dominated data is calculated using 1-second bins in cleaned event files. If a bin has >2000 counts, and if more than 50% of those come from <1% of pixels, then it is considered to be noise-dominated and hence unusable.
| Quadrant | # 1 sec bins | Bins with >0 counts | Bins with >2000 counts | High rate bins dominated by noise | Noise dominated (total time) | Noise dominated (detector-on time) | Marked lightcurve |
|---|---|---|---|---|---|---|---|
| A | 6656 | 5502 | 0 | 0 | 0.00% | 0.00% |  |
| B | 6656 | 5502 | 0 | 0 | 0.00% | 0.00% | 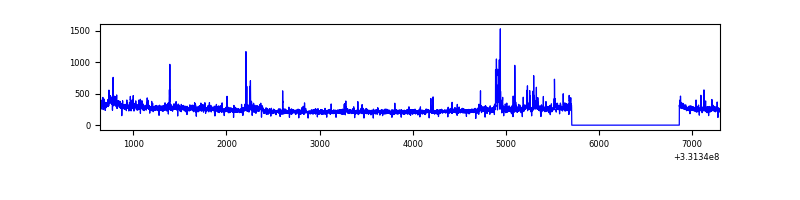 |
| C | 6656 | 5502 | 0 | 0 | 0.00% | 0.00% | 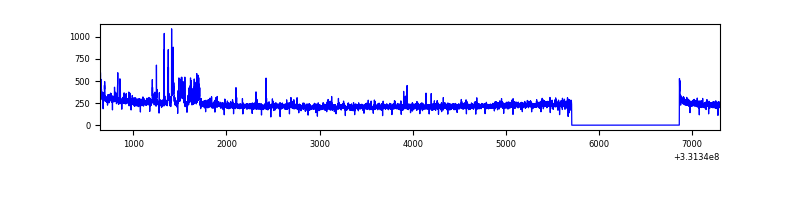 |
| D | 6656 | 5501 | 25 | 25 | 0.38% | 0.45% |  |
Top three noisy pixels from each quadrant. If the there are fewer than three noisy pixels in the level2.evt file, extra rows are filled as -1
| Pixel properties | Quadrant properties | ||||||
|---|---|---|---|---|---|---|---|
| Quadrant | DetID | PixID | Counts | Sigma | Mean | Median | Sigma |
| A | 6 | 16 | 24967 | 351.85 | 324 | 319 | 70.1 |
| A | 13 | 254 | 8469 | 116.34 | 324 | 319 | 70.1 |
| A | 13 | 220 | 2372 | 29.31 | 324 | 319 | 70.1 |
| B | 3 | 112 | 36132 | 563.16 | 332 | 325 | 63.6 |
| B | 4 | 171 | 30597 | 476.11 | 332 | 325 | 63.6 |
| B | 0 | 190 | 23916 | 371.03 | 332 | 325 | 63.6 |
| C | 3 | 233 | 61964 | 807.77 | 321 | 320 | 76.3 |
| C | 0 | 10 | 4290 | 52.02 | 321 | 320 | 76.3 |
| C | 1 | 16 | 1956 | 21.43 | 321 | 320 | 76.3 |
| D | 1 | 52 | 1010417 | 12266.9 | 315 | 306 | 82.3 |
| D | 7 | 80 | 209595 | 2541.63 | 315 | 306 | 82.3 |
| D | 13 | 104 | 30361 | 364.99 | 315 | 306 | 82.3 |
Histogram calculated using DETX and DETY for each event in the final _common_clean file
| Quadrant A | 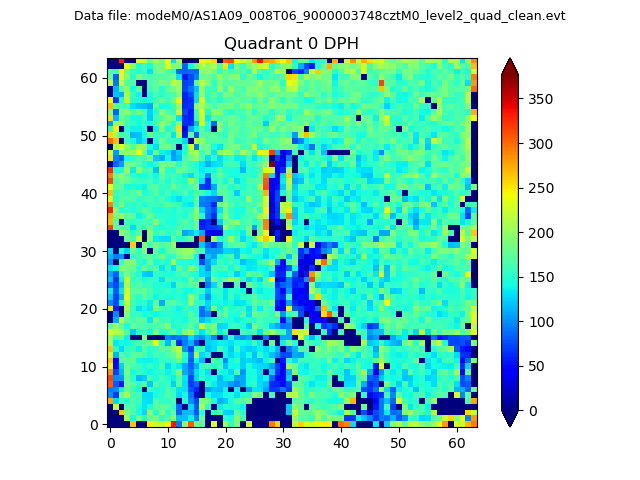 |
 |
Quadrant B |
|---|---|---|---|
| Quadrant D |  |
 |
Quadrant C |
| Plot type | Count rate plots | Images |
|---|---|---|
| Comparison with Poisson distribution Blue bars denote a histogram of data divided into 1 sec bins. Red curve is a Poisson curve with rate = median count rate of data. |
 |
 |
| Quadrant-wise count rates Data is divided into 100 sec bins |
 |
|
| Module-wise count rates for Quadrant A Data is divided into 100 sec bins |
 |
 |
| Module-wise count rates for Quadrant B Data is divided into 100 sec bins |
 |
 |
| Module-wise count rates for Quadrant C Data is divided into 100 sec bins |
 |
 |
| Module-wise count rates for Quadrant D Data is divided into 100 sec bins |
 |
 |
| Parameter | Plot |
|---|---|
| CZT HV Monitor |  |
| D_VDD |  |
| Temperature 1 |  |
| Veto HV Monitor |  |
| Veto LLD | 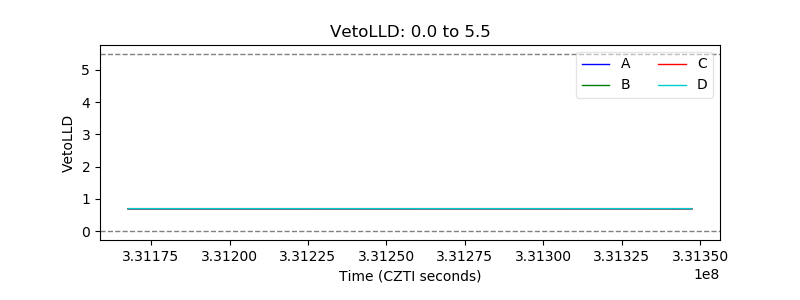 |
| Alpha Counter | 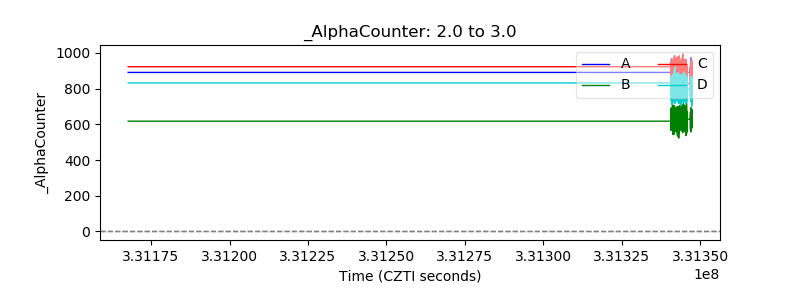 |
| _CPM_Rate | 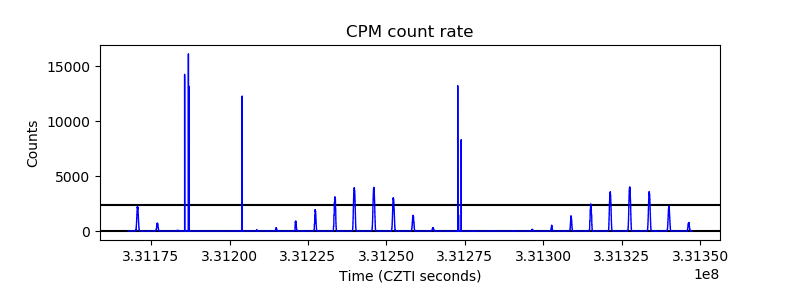 |
| CZT Counter |  |
| +2.5 Volts monitor |  |
| +5 Volts monitor | 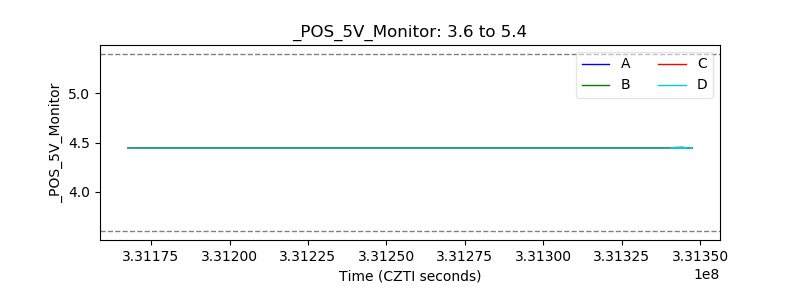 |
| _ROLL_ROT |  |
| _Roll_DEC | 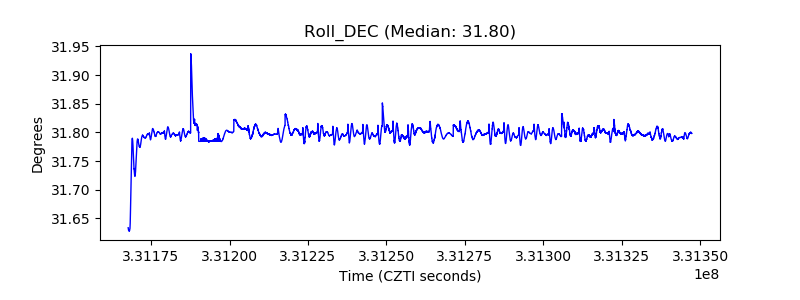 |
| _Roll_RA |  |
| Veto Counter |  |