| Param | Original file | Final file |
|---|---|---|
| Filename | modeM0/AS1A09_008T03_9000003746cztM0_level2_bc.evt | modeM0/AS1A09_008T03_9000003746cztM0_level2_quad_clean.evt |
| Size (bytes) | 4,318,773,120 | 1,172,160,000 |
| Size | 4.0 GB | 1.1 GB |
| Events in quadrant A | 46,016,306 | 6,986,631 |
| Events in quadrant B | 21,247,990 | 7,806,167 |
| Events in quadrant C | 20,957,462 | 7,277,821 |
| Events in quadrant D | 36,211,231 | 7,022,133 |
| Mode M9 | |||
|---|---|---|---|
| Quadrant | BADHDUFLAG | Total packets | Discarded packets |
| A | 0 | 174 | 0 |
| B | 0 | 174 | 0 |
| C | 0 | 174 | 0 |
| D | 0 | 174 | 0 |
| Mode SS | |||
|---|---|---|---|
| Quadrant | BADHDUFLAG | Total packets | Discarded packets |
| A | 0 | 1910 | 0 |
| B | 0 | 1910 | 0 |
| C | 0 | 1910 | 0 |
| D | 0 | 1910 | 0 |
| Mode M0 | |||
|---|---|---|---|
| Quadrant | BADHDUFLAG | Total packets | Discarded packets |
| A | 0 | 281619 | 0 |
| B | 0 | 198859 | 0 |
| C | 0 | 201428 | 0 |
| D | 0 | 247752 | 0 |
| Quadrant | Total seconds | Saturated seconds | Saturation percentage |
|---|---|---|---|
| A | 93466 | 12000 | 12.838893% |
| B | 93466 | 1252 | 1.339525% |
| C | 93466 | 2070 | 2.214709% |
| D | 93466 | 4242 | 4.538549% |
Noise dominated data is calculated using 1-second bins in cleaned event files. If a bin has >2000 counts, and if more than 50% of those come from <1% of pixels, then it is considered to be noise-dominated and hence unusable.
| Quadrant | # 1 sec bins | Bins with >0 counts | Bins with >2000 counts | High rate bins dominated by noise | Noise dominated (total time) | Noise dominated (detector-on time) | Marked lightcurve |
|---|---|---|---|---|---|---|---|
| A | 111031 | 93459 | 6460 | 6460 | 5.82% | 6.91% |  |
| B | 111031 | 93461 | 4 | 4 | 0.00% | 0.00% |  |
| C | 111031 | 93460 | 107 | 107 | 0.10% | 0.11% |  |
| D | 111031 | 93461 | 1028 | 1028 | 0.93% | 1.10% |  |
Top three noisy pixels from each quadrant. If the there are fewer than three noisy pixels in the level2.evt file, extra rows are filled as -1
| Pixel properties | Quadrant properties | ||||||
|---|---|---|---|---|---|---|---|
| Quadrant | DetID | PixID | Counts | Sigma | Mean | Median | Sigma |
| A | 0 | 13 | 26757421 | 25258.17 | 4929 | 4853 | 1059.2 |
| A | 13 | 254 | 117862 | 106.7 | 4929 | 4853 | 1059.2 |
| A | 8 | 192 | 97367 | 87.35 | 4929 | 4853 | 1059.2 |
| B | 0 | 219 | 275185 | 270.51 | 5276 | 5151 | 998.2 |
| B | 0 | 245 | 257219 | 252.51 | 5276 | 5151 | 998.2 |
| B | 0 | 190 | 238149 | 233.41 | 5276 | 5151 | 998.2 |
| C | 3 | 233 | 1964585 | 1714.42 | 4925 | 4905 | 1143.1 |
| C | 13 | 61 | 28749 | 20.86 | 4925 | 4905 | 1143.1 |
| C | 14 | 225 | 24585 | 17.22 | 4925 | 4905 | 1143.1 |
| D | 1 | 52 | 6670373 | 5875.5 | 4956 | 4790 | 1134.5 |
| D | 7 | 80 | 4866639 | 4285.57 | 4956 | 4790 | 1134.5 |
| D | 8 | 195 | 3933041 | 3462.63 | 4956 | 4790 | 1134.5 |
Histogram calculated using DETX and DETY for each event in the final _common_clean file
| Quadrant A |  |
 |
Quadrant B |
|---|---|---|---|
| Quadrant D |  |
 |
Quadrant C |
| Plot type | Count rate plots | Images |
|---|---|---|
| Comparison with Poisson distribution Blue bars denote a histogram of data divided into 1 sec bins. Red curve is a Poisson curve with rate = median count rate of data. |
 |
 |
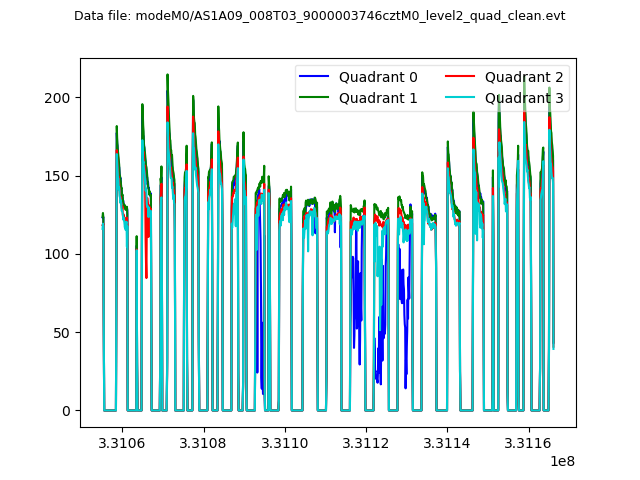
| Quadrant-wise count rates Data is divided into 100 sec bins |
 |
|
| Module-wise count rates for Quadrant A Data is divided into 100 sec bins |
 |
 |
| Module-wise count rates for Quadrant B Data is divided into 100 sec bins |
 |
 |
| Module-wise count rates for Quadrant C Data is divided into 100 sec bins |
 |
 |
| Module-wise count rates for Quadrant D Data is divided into 100 sec bins |
 |
 |
| Parameter | Plot |
|---|---|
| CZT HV Monitor |  |
| D_VDD |  |
| Temperature 1 |  |
| Veto HV Monitor |  |
| Veto LLD |  |
| Alpha Counter | 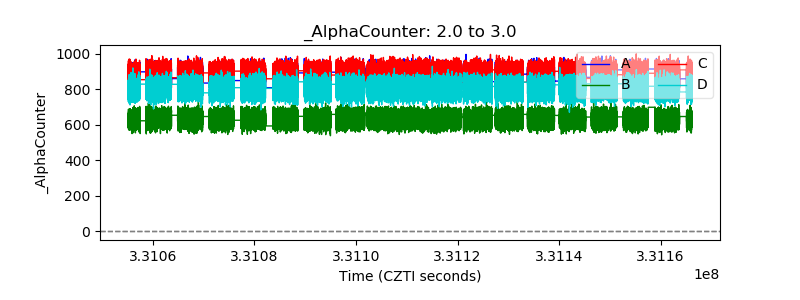 |
| _CPM_Rate |  |
| CZT Counter | 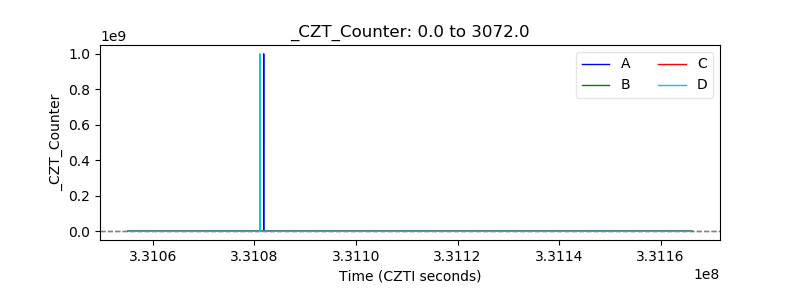 |
| +2.5 Volts monitor |  |
| +5 Volts monitor |  |
| _ROLL_ROT |  |
| _Roll_DEC |  |
| _Roll_RA |  |
| Veto Counter | 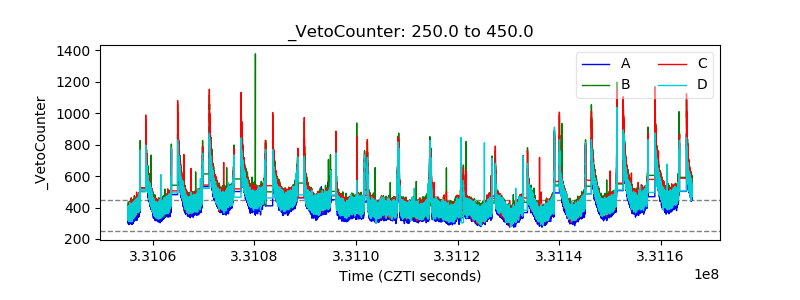 |