| Param | Original file | Final file |
|---|---|---|
| Filename | modeM0/AS1A09_043T01_9000003744cztM0_level2_bc.evt | modeM0/AS1A09_043T01_9000003744cztM0_level2_quad_clean.evt |
| Size (bytes) | 2,986,297,920 | 985,331,520 |
| Size | 2.8 GB | 939.7 MB |
| Events in quadrant A | 19,902,379 | 6,321,776 |
| Events in quadrant B | 17,016,598 | 6,422,991 |
| Events in quadrant C | 15,542,859 | 6,034,554 |
| Events in quadrant D | 32,767,648 | 5,818,421 |
| Mode SS | |||
|---|---|---|---|
| Quadrant | BADHDUFLAG | Total packets | Discarded packets |
| A | 0 | 1562 | 0 |
| B | 0 | 1562 | 0 |
| C | 0 | 1562 | 0 |
| D | 0 | 1562 | 0 |
| Mode M9 | |||
|---|---|---|---|
| Quadrant | BADHDUFLAG | Total packets | Discarded packets |
| A | 0 | 117 | 0 |
| B | 0 | 118 | 0 |
| C | 0 | 118 | 0 |
| D | 0 | 118 | 0 |
| Mode M0 | |||
|---|---|---|---|
| Quadrant | BADHDUFLAG | Total packets | Discarded packets |
| A | 0 | 169083 | 0 |
| B | 0 | 161449 | 0 |
| C | 0 | 159143 | 0 |
| D | 0 | 211819 | 0 |
| Quadrant | Total seconds | Saturated seconds | Saturation percentage |
|---|---|---|---|
| A | 76525 | 1103 | 1.441359% |
| B | 76525 | 994 | 1.298922% |
| C | 76525 | 1238 | 1.617772% |
| D | 76525 | 2209 | 2.886638% |
Noise dominated data is calculated using 1-second bins in cleaned event files. If a bin has >2000 counts, and if more than 50% of those come from <1% of pixels, then it is considered to be noise-dominated and hence unusable.
| Quadrant | # 1 sec bins | Bins with >0 counts | Bins with >2000 counts | High rate bins dominated by noise | Noise dominated (total time) | Noise dominated (detector-on time) | Marked lightcurve |
|---|---|---|---|---|---|---|---|
| A | 93357 | 76520 | 36 | 36 | 0.04% | 0.05% |  |
| B | 93357 | 76522 | 7 | 7 | 0.01% | 0.01% |  |
| C | 93357 | 76522 | 6 | 6 | 0.01% | 0.01% |  |
| D | 93357 | 76522 | 520 | 520 | 0.56% | 0.68% | 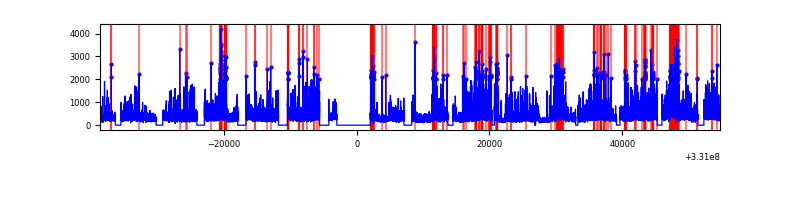 |
Top three noisy pixels from each quadrant. If the there are fewer than three noisy pixels in the level2.evt file, extra rows are filled as -1
| Pixel properties | Quadrant properties | ||||||
|---|---|---|---|---|---|---|---|
| Quadrant | DetID | PixID | Counts | Sigma | Mean | Median | Sigma |
| A | 8 | 192 | 2905925 | 3193.69 | 4179 | 4106 | 908.6 |
| A | 0 | 13 | 839366 | 919.27 | 4179 | 4106 | 908.6 |
| A | 13 | 254 | 105747 | 111.86 | 4179 | 4106 | 908.6 |
| B | 3 | 112 | 345845 | 430.66 | 4225 | 4124 | 793.5 |
| B | 0 | 245 | 218347 | 269.98 | 4225 | 4124 | 793.5 |
| B | 15 | 33 | 120014 | 146.05 | 4225 | 4124 | 793.5 |
| C | 3 | 233 | 133668 | 140.36 | 3970 | 3953 | 924.2 |
| C | 14 | 225 | 124079 | 129.98 | 3970 | 3953 | 924.2 |
| C | 2 | 16 | 27327 | 25.29 | 3970 | 3953 | 924.2 |
| D | 1 | 52 | 9600412 | 10371.89 | 4019 | 3879 | 925.2 |
| D | 8 | 195 | 5147357 | 5559.05 | 4019 | 3879 | 925.2 |
| D | 2 | 244 | 931994 | 1003.1 | 4019 | 3879 | 925.2 |
Histogram calculated using DETX and DETY for each event in the final _common_clean file
| Quadrant A |  |
 |
Quadrant B |
|---|---|---|---|
| Quadrant D |  |
 |
Quadrant C |
| Plot type | Count rate plots | Images |
|---|---|---|
| Comparison with Poisson distribution Blue bars denote a histogram of data divided into 1 sec bins. Red curve is a Poisson curve with rate = median count rate of data. |
 |
 |
| Quadrant-wise count rates Data is divided into 100 sec bins |
 |
|
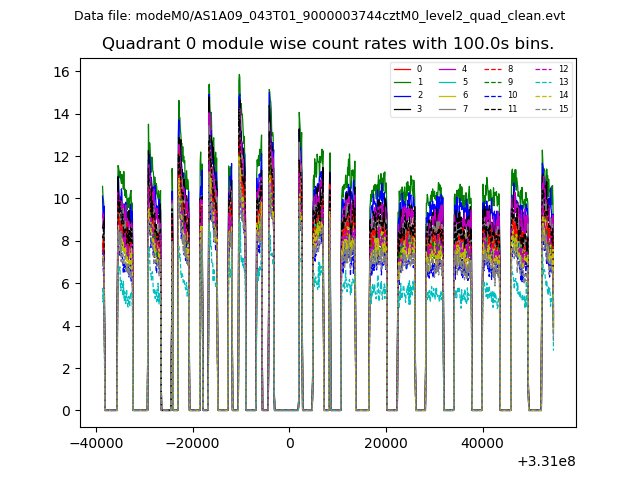
| Module-wise count rates for Quadrant A Data is divided into 100 sec bins |
 |
 |
| Module-wise count rates for Quadrant B Data is divided into 100 sec bins |
 |
 |
| Module-wise count rates for Quadrant C Data is divided into 100 sec bins |
 |
 |
| Module-wise count rates for Quadrant D Data is divided into 100 sec bins |
 |
 |
| Parameter | Plot |
|---|---|
| CZT HV Monitor |  |
| D_VDD |  |
| Temperature 1 |  |
| Veto HV Monitor |  |
| Veto LLD | 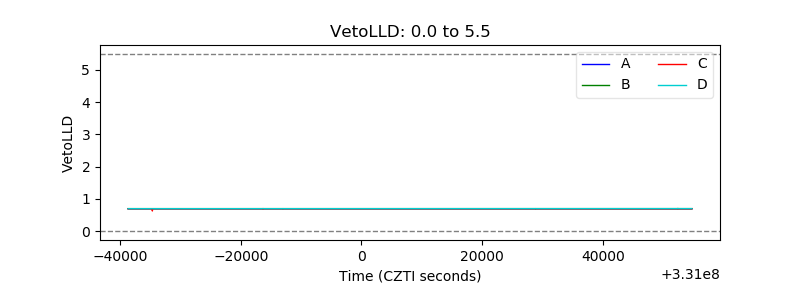 |
| Alpha Counter | 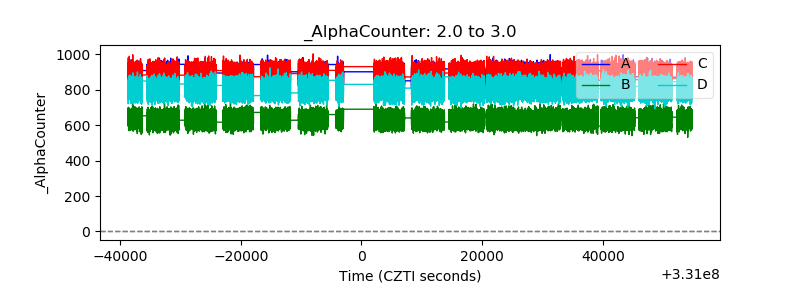 |
| _CPM_Rate |  |
| CZT Counter |  |
| +2.5 Volts monitor |  |
| +5 Volts monitor |  |
| _ROLL_ROT |  |
| _Roll_DEC |  |
| _Roll_RA |  |
| Veto Counter | 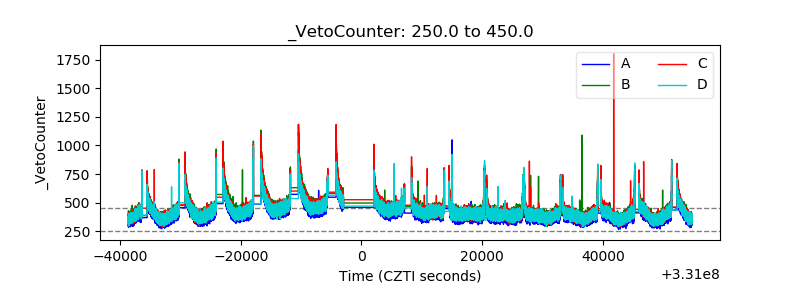 |