| Param | Original file | Final file |
|---|---|---|
| Filename | modeM0/AS1A09_016T03_9000003740cztM0_level2_bc.evt | modeM0/AS1A09_016T03_9000003740cztM0_level2_quad_clean.evt |
| Size (bytes) | 1,130,302,080 | 400,455,360 |
| Size | 1.1 GB | 381.9 MB |
| Events in quadrant A | 8,038,941 | 2,550,746 |
| Events in quadrant B | 6,939,229 | 2,601,529 |
| Events in quadrant C | 6,515,744 | 2,435,248 |
| Events in quadrant D | 10,583,697 | 2,374,901 |
| Mode M0 | |||
|---|---|---|---|
| Quadrant | BADHDUFLAG | Total packets | Discarded packets |
| A | 0 | 68924 | 0 |
| B | 0 | 66149 | 0 |
| C | 0 | 65785 | 0 |
| D | 0 | 76434 | 0 |
| Mode M9 | |||
|---|---|---|---|
| Quadrant | BADHDUFLAG | Total packets | Discarded packets |
| A | 0 | 31 | 0 |
| B | 0 | 31 | 0 |
| C | 0 | 31 | 0 |
| D | 0 | 31 | 0 |
| Mode SS | |||
|---|---|---|---|
| Quadrant | BADHDUFLAG | Total packets | Discarded packets |
| A | 0 | 642 | 0 |
| B | 0 | 642 | 0 |
| C | 0 | 642 | 0 |
| D | 0 | 642 | 0 |
| Quadrant | Total seconds | Saturated seconds | Saturation percentage |
|---|---|---|---|
| A | 31528 | 864 | 2.740421% |
| B | 31528 | 755 | 2.394697% |
| C | 31528 | 786 | 2.493022% |
| D | 31528 | 639 | 2.026770% |
Noise dominated data is calculated using 1-second bins in cleaned event files. If a bin has >2000 counts, and if more than 50% of those come from <1% of pixels, then it is considered to be noise-dominated and hence unusable.
| Quadrant | # 1 sec bins | Bins with >0 counts | Bins with >2000 counts | High rate bins dominated by noise | Noise dominated (total time) | Noise dominated (detector-on time) | Marked lightcurve |
|---|---|---|---|---|---|---|---|
| A | 34627 | 31524 | 15 | 15 | 0.04% | 0.05% |  |
| B | 34627 | 31525 | 1 | 1 | 0.00% | 0.00% |  |
| C | 34628 | 31526 | 0 | 0 | 0.00% | 0.00% |  |
| D | 34627 | 31527 | 44 | 44 | 0.13% | 0.14% |  |
Top three noisy pixels from each quadrant. If the there are fewer than three noisy pixels in the level2.evt file, extra rows are filled as -1
| Pixel properties | Quadrant properties | ||||||
|---|---|---|---|---|---|---|---|
| Quadrant | DetID | PixID | Counts | Sigma | Mean | Median | Sigma |
| A | 12 | 96 | 686537 | 1839.64 | 1729 | 1699 | 372.3 |
| A | 8 | 192 | 627905 | 1682.14 | 1729 | 1699 | 372.3 |
| A | 13 | 254 | 39412 | 101.31 | 1729 | 1699 | 372.3 |
| B | 0 | 245 | 115200 | 346.15 | 1755 | 1715 | 327.8 |
| B | 3 | 112 | 52733 | 155.61 | 1755 | 1715 | 327.8 |
| B | 0 | 190 | 44698 | 131.11 | 1755 | 1715 | 327.8 |
| C | 3 | 233 | 53192 | 133.46 | 1654 | 1649 | 386.2 |
| C | 2 | 16 | 43980 | 109.61 | 1654 | 1649 | 386.2 |
| C | 5 | 112 | 40932 | 101.71 | 1654 | 1649 | 386.2 |
| D | 8 | 195 | 2216992 | 5719.14 | 1677 | 1618 | 387.4 |
| D | 1 | 52 | 1653182 | 4263.63 | 1677 | 1618 | 387.4 |
| D | 2 | 244 | 132001 | 336.59 | 1677 | 1618 | 387.4 |
Histogram calculated using DETX and DETY for each event in the final _common_clean file
| Quadrant A |  |
 |
Quadrant B |
|---|---|---|---|
| Quadrant D | 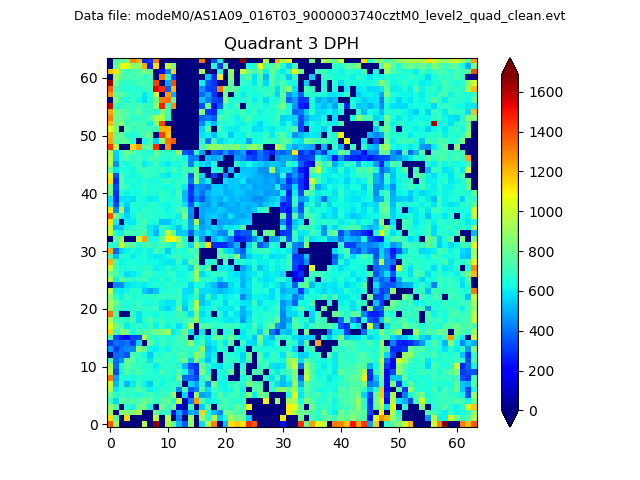 |
 |
Quadrant C |
| Plot type | Count rate plots | Images |
|---|---|---|
| Comparison with Poisson distribution Blue bars denote a histogram of data divided into 1 sec bins. Red curve is a Poisson curve with rate = median count rate of data. |
 |
 |
| Quadrant-wise count rates Data is divided into 100 sec bins |
 |
|
| Module-wise count rates for Quadrant A Data is divided into 100 sec bins |
 |
 |
| Module-wise count rates for Quadrant B Data is divided into 100 sec bins |
 |
 |
| Module-wise count rates for Quadrant C Data is divided into 100 sec bins |
 |
 |
| Module-wise count rates for Quadrant D Data is divided into 100 sec bins |
 |
 |
| Parameter | Plot |
|---|---|
| CZT HV Monitor |  |
| D_VDD |  |
| Temperature 1 |  |
| Veto HV Monitor |  |
| Veto LLD |  |
| Alpha Counter |  |
| _CPM_Rate |  |
| CZT Counter |  |
| +2.5 Volts monitor | 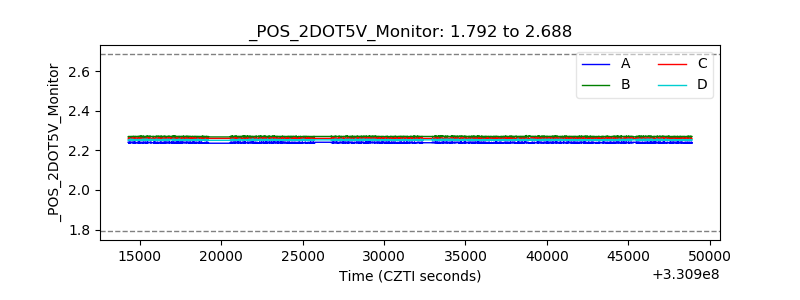 |
| +5 Volts monitor |  |
| _ROLL_ROT |  |
| _Roll_DEC | 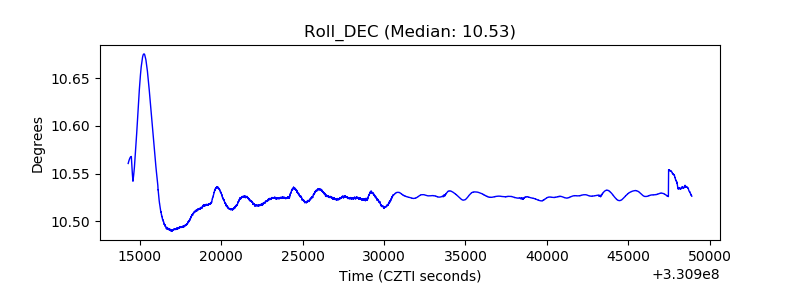 |
| _Roll_RA | 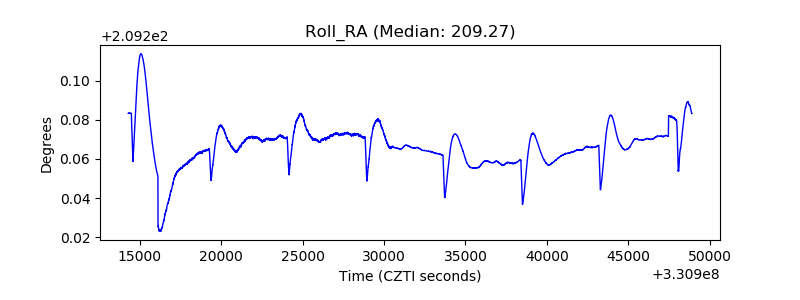 |
| Veto Counter | 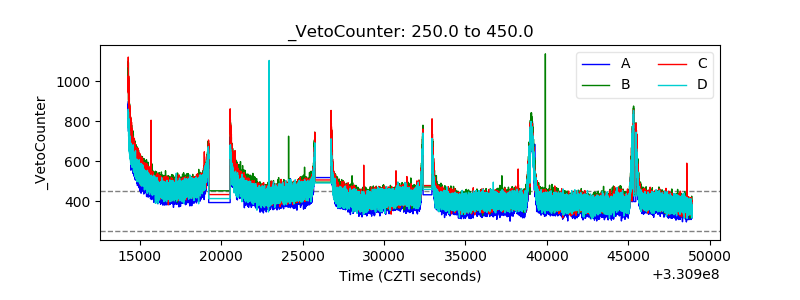 |