| Param | Original file | Final file |
|---|---|---|
| Filename | modeM0/AS1A09_006T05_9000003736cztM0_level2_bc.evt | modeM0/AS1A09_006T05_9000003736cztM0_level2_quad_clean.evt |
| Size (bytes) | 297,380,160 | 100,563,840 |
| Size | 283.6 MB | 95.9 MB |
| Events in quadrant A | 2,059,822 | 644,664 |
| Events in quadrant B | 1,701,398 | 643,269 |
| Events in quadrant C | 1,561,433 | 614,169 |
| Events in quadrant D | 3,137,078 | 593,931 |
| Mode SS | |||
|---|---|---|---|
| Quadrant | BADHDUFLAG | Total packets | Discarded packets |
| A | 0 | 166 | 0 |
| B | 0 | 164 | 0 |
| C | 0 | 160 | 0 |
| D | 0 | 162 | 0 |
| Mode M9 | |||
|---|---|---|---|
| Quadrant | BADHDUFLAG | Total packets | Discarded packets |
| A | 0 | 33 | 0 |
| B | 0 | 33 | 0 |
| C | 0 | 14 | 0 |
| D | 0 | 33 | 0 |
| Mode M0 | |||
|---|---|---|---|
| Quadrant | BADHDUFLAG | Total packets | Discarded packets |
| A | 0 | 17885 | 0 |
| B | 0 | 16676 | 0 |
| C | 0 | 16443 | 0 |
| D | 0 | 21039 | 0 |
| Quadrant | Total seconds | Saturated seconds | Saturation percentage |
|---|---|---|---|
| A | 7926 | 131 | 1.652788% |
| B | 7896 | 133 | 1.684397% |
| C | 7922 | 164 | 2.070184% |
| D | 7865 | 363 | 4.615385% |
Noise dominated data is calculated using 1-second bins in cleaned event files. If a bin has >2000 counts, and if more than 50% of those come from <1% of pixels, then it is considered to be noise-dominated and hence unusable.
| Quadrant | # 1 sec bins | Bins with >0 counts | Bins with >2000 counts | High rate bins dominated by noise | Noise dominated (total time) | Noise dominated (detector-on time) | Marked lightcurve |
|---|---|---|---|---|---|---|---|
| A | 8759 | 7758 | 0 | 0 | 0.00% | 0.00% |  |
| B | 8759 | 7737 | 1 | 1 | 0.01% | 0.01% |  |
| C | 8759 | 7756 | 0 | 0 | 0.00% | 0.00% |  |
| D | 8759 | 7725 | 110 | 110 | 1.26% | 1.42% |  |
Top three noisy pixels from each quadrant. If the there are fewer than three noisy pixels in the level2.evt file, extra rows are filled as -1
| Pixel properties | Quadrant properties | ||||||
|---|---|---|---|---|---|---|---|
| Quadrant | DetID | PixID | Counts | Sigma | Mean | Median | Sigma |
| A | 8 | 192 | 441673 | 4742.41 | 417 | 408 | 93.0 |
| A | 13 | 254 | 11692 | 121.27 | 417 | 408 | 93.0 |
| A | 6 | 16 | 8429 | 86.2 | 417 | 408 | 93.0 |
| B | 0 | 245 | 38259 | 458.94 | 417 | 407 | 82.5 |
| B | 0 | 190 | 26779 | 319.75 | 417 | 407 | 82.5 |
| B | 10 | 247 | 11519 | 134.73 | 417 | 407 | 82.5 |
| C | 3 | 233 | 24682 | 253.91 | 397 | 393 | 95.7 |
| C | 2 | 16 | 8959 | 89.55 | 397 | 393 | 95.7 |
| C | 13 | 61 | 2310 | 20.04 | 397 | 393 | 95.7 |
| D | 1 | 52 | 1053557 | 10264.17 | 396 | 382 | 102.6 |
| D | 8 | 195 | 338222 | 3292.56 | 396 | 382 | 102.6 |
| D | 12 | 233 | 58455 | 565.98 | 396 | 382 | 102.6 |
Histogram calculated using DETX and DETY for each event in the final _common_clean file
| Quadrant A |  |
 |
Quadrant B |
|---|---|---|---|
| Quadrant D | 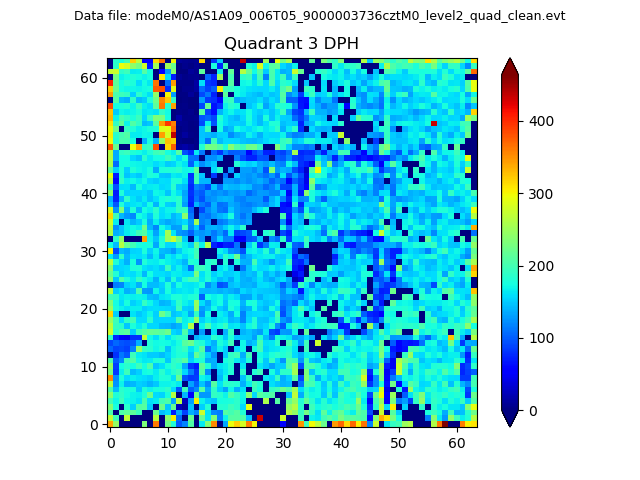 |
 |
Quadrant C |
| Plot type | Count rate plots | Images |
|---|---|---|
| Comparison with Poisson distribution Blue bars denote a histogram of data divided into 1 sec bins. Red curve is a Poisson curve with rate = median count rate of data. |
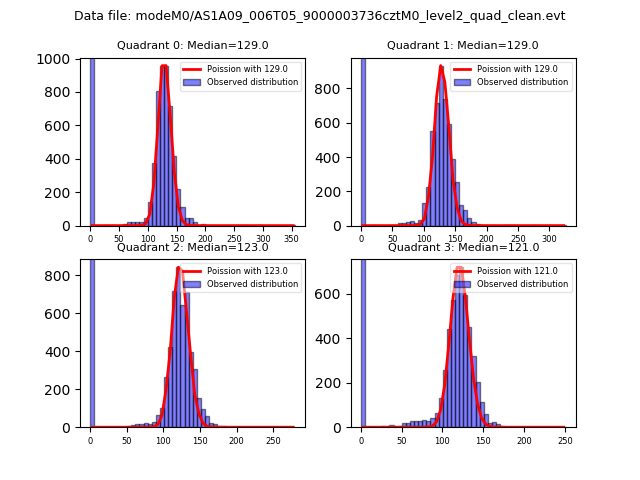 |
 |
| Quadrant-wise count rates Data is divided into 100 sec bins |
 |
|
| Module-wise count rates for Quadrant A Data is divided into 100 sec bins |
 |
 |
| Module-wise count rates for Quadrant B Data is divided into 100 sec bins |
 |
 |
| Module-wise count rates for Quadrant C Data is divided into 100 sec bins |
 |
 |
| Module-wise count rates for Quadrant D Data is divided into 100 sec bins |
 |
 |
| Parameter | Plot |
|---|---|
| CZT HV Monitor |  |
| D_VDD |  |
| Temperature 1 |  |
| Veto HV Monitor |  |
| Veto LLD | 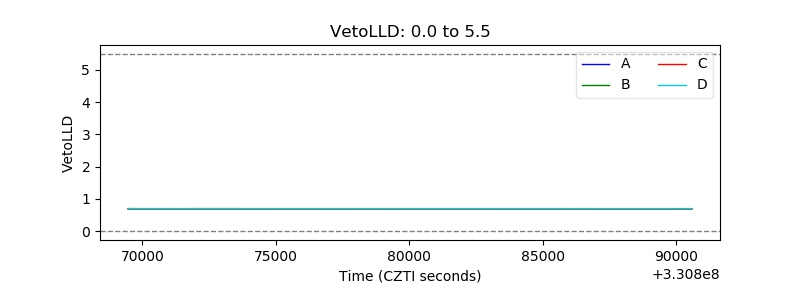 |
| Alpha Counter |  |
| _CPM_Rate |  |
| CZT Counter | 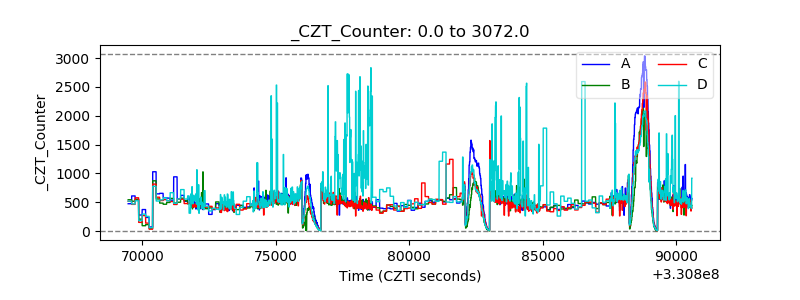 |
| +2.5 Volts monitor | 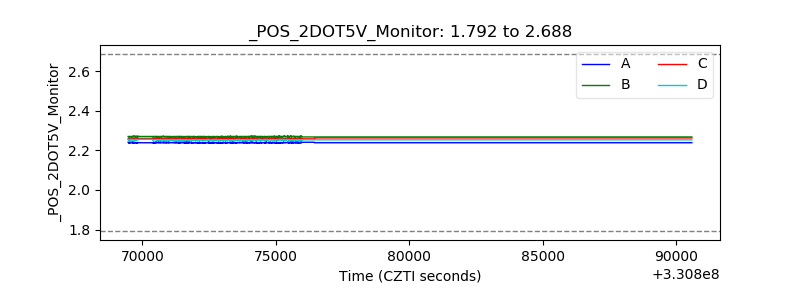 |
| +5 Volts monitor |  |
| _ROLL_ROT |  |
| _Roll_DEC |  |
| _Roll_RA |  |
| Veto Counter |  |