| Param | Original file | Final file |
|---|---|---|
| Filename | modeM0/AS1A09_006T04_9000003738cztM0_level2_bc.evt | modeM0/AS1A09_006T04_9000003738cztM0_level2_quad_clean.evt |
| Size (bytes) | 700,819,200 | 224,452,800 |
| Size | 668.4 MB | 214.1 MB |
| Events in quadrant A | 5,353,559 | 1,425,887 |
| Events in quadrant B | 4,362,995 | 1,466,004 |
| Events in quadrant C | 4,088,955 | 1,363,497 |
| Events in quadrant D | 6,192,309 | 1,307,074 |
| Mode M0 | |||
|---|---|---|---|
| Quadrant | BADHDUFLAG | Total packets | Discarded packets |
| A | 0 | 42653 | 0 |
| B | 0 | 38548 | 0 |
| C | 0 | 38277 | 0 |
| D | 0 | 44844 | 0 |
| Mode SS | |||
|---|---|---|---|
| Quadrant | BADHDUFLAG | Total packets | Discarded packets |
| A | 0 | 366 | 0 |
| B | 0 | 366 | 0 |
| C | 0 | 366 | 0 |
| D | 0 | 366 | 0 |
| Mode M9 | |||
|---|---|---|---|
| Quadrant | BADHDUFLAG | Total packets | Discarded packets |
| A | 0 | 46 | 0 |
| B | 0 | 46 | 0 |
| C | 0 | 46 | 0 |
| D | 0 | 46 | 0 |
| Quadrant | Total seconds | Saturated seconds | Saturation percentage |
|---|---|---|---|
| A | 17932 | 55 | 0.306714% |
| B | 17932 | 70 | 0.390364% |
| C | 17932 | 163 | 0.908990% |
| D | 17932 | 225 | 1.254740% |
Noise dominated data is calculated using 1-second bins in cleaned event files. If a bin has >2000 counts, and if more than 50% of those come from <1% of pixels, then it is considered to be noise-dominated and hence unusable.
| Quadrant | # 1 sec bins | Bins with >0 counts | Bins with >2000 counts | High rate bins dominated by noise | Noise dominated (total time) | Noise dominated (detector-on time) | Marked lightcurve |
|---|---|---|---|---|---|---|---|
| A | 21842 | 17933 | 0 | 0 | 0.00% | 0.00% |  |
| B | 21842 | 17932 | 1 | 1 | 0.00% | 0.01% | 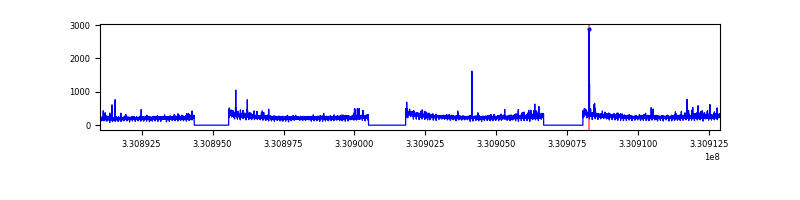 |
| C | 21842 | 17933 | 3 | 3 | 0.01% | 0.02% |  |
| D | 21842 | 17932 | 35 | 35 | 0.16% | 0.20% |  |
Top three noisy pixels from each quadrant. If the there are fewer than three noisy pixels in the level2.evt file, extra rows are filled as -1
| Pixel properties | Quadrant properties | ||||||
|---|---|---|---|---|---|---|---|
| Quadrant | DetID | PixID | Counts | Sigma | Mean | Median | Sigma |
| A | 8 | 192 | 1108826 | 4755.32 | 1090 | 1074 | 233.0 |
| A | 13 | 254 | 25377 | 104.33 | 1090 | 1074 | 233.0 |
| A | 12 | 96 | 25373 | 104.31 | 1090 | 1074 | 233.0 |
| B | 0 | 245 | 51107 | 244.8 | 1110 | 1087 | 204.3 |
| B | 3 | 112 | 25966 | 121.76 | 1110 | 1087 | 204.3 |
| B | 0 | 229 | 25062 | 117.34 | 1110 | 1087 | 204.3 |
| C | 5 | 112 | 63173 | 261.2 | 1028 | 1026 | 237.9 |
| C | 3 | 233 | 58208 | 240.33 | 1028 | 1026 | 237.9 |
| C | 1 | 16 | 12326 | 47.49 | 1028 | 1026 | 237.9 |
| D | 1 | 52 | 1460107 | 6267.8 | 1033 | 999 | 232.8 |
| D | 8 | 195 | 639616 | 2743.27 | 1033 | 999 | 232.8 |
| D | 13 | 104 | 84577 | 359.02 | 1033 | 999 | 232.8 |
Histogram calculated using DETX and DETY for each event in the final _common_clean file
| Quadrant A |  |
 |
Quadrant B |
|---|---|---|---|
| Quadrant D |  |
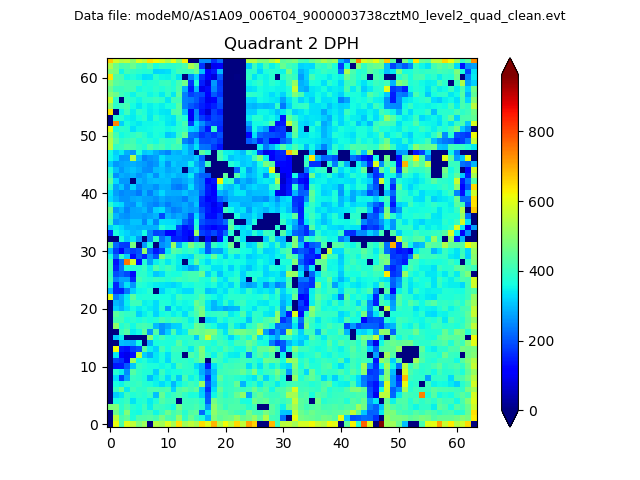 |
Quadrant C |
| Plot type | Count rate plots | Images |
|---|---|---|
| Comparison with Poisson distribution Blue bars denote a histogram of data divided into 1 sec bins. Red curve is a Poisson curve with rate = median count rate of data. |
 |
 |
| Quadrant-wise count rates Data is divided into 100 sec bins |
 |
|
| Module-wise count rates for Quadrant A Data is divided into 100 sec bins |
 |
 |
| Module-wise count rates for Quadrant B Data is divided into 100 sec bins |
 |
 |
| Module-wise count rates for Quadrant C Data is divided into 100 sec bins |
 |
 |
| Module-wise count rates for Quadrant D Data is divided into 100 sec bins |
 |
 |
| Parameter | Plot |
|---|---|
| CZT HV Monitor |  |
| D_VDD |  |
| Temperature 1 |  |
| Veto HV Monitor |  |
| Veto LLD | 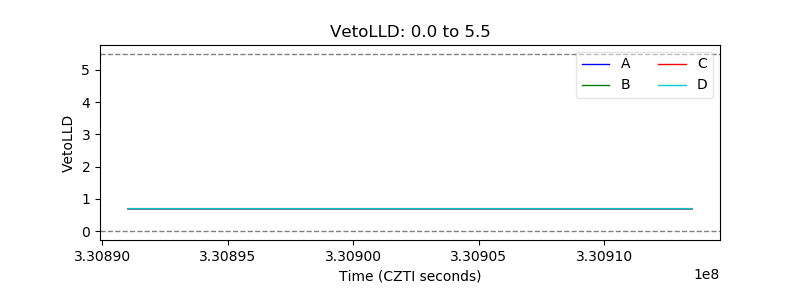 |
| Alpha Counter | 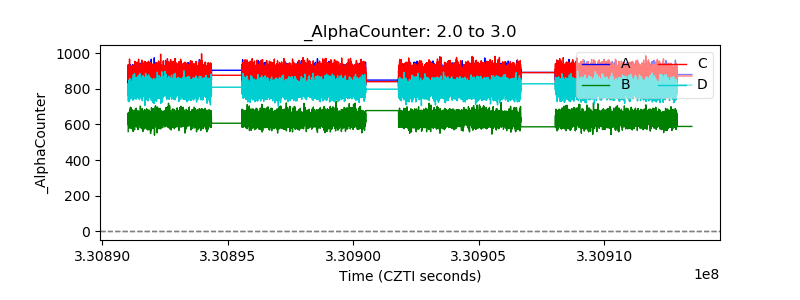 |
| _CPM_Rate |  |
| CZT Counter |  |
| +2.5 Volts monitor |  |
| +5 Volts monitor | 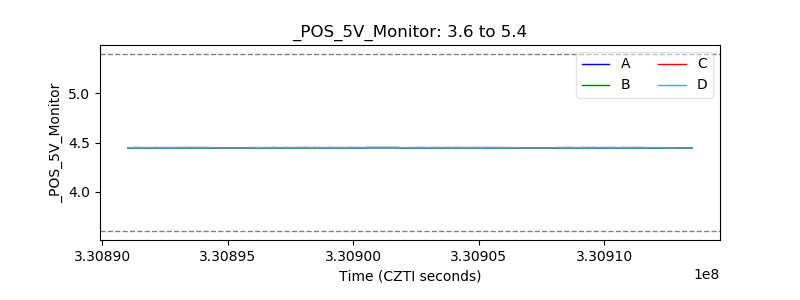 |
| _ROLL_ROT | 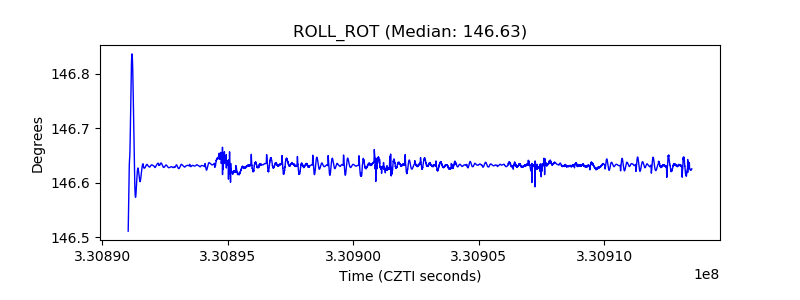 |
| _Roll_DEC | 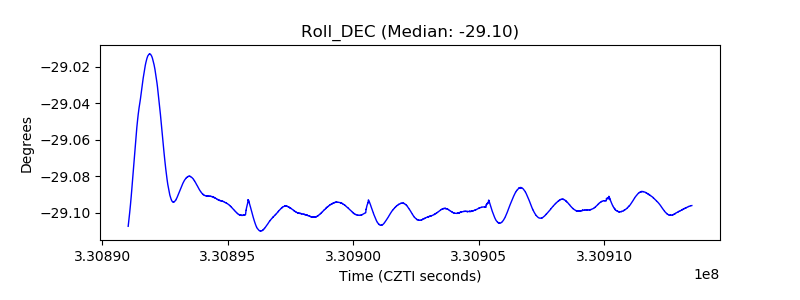 |
| _Roll_RA |  |
| Veto Counter |  |