| Param | Original file | Final file |
|---|---|---|
| Filename | modeM0/AS1A09_013T02_9000003734cztM0_level2_bc.evt | modeM0/AS1A09_013T02_9000003734cztM0_level2_quad_clean.evt |
| Size (bytes) | 4,645,457,280 | 1,824,177,600 |
| Size | 4.3 GB | 1.7 GB |
| Events in quadrant A | 29,668,579 | 11,882,050 |
| Events in quadrant B | 28,083,248 | 12,088,353 |
| Events in quadrant C | 26,181,447 | 11,549,856 |
| Events in quadrant D | 48,221,993 | 11,146,900 |
| Mode M9 | |||
|---|---|---|---|
| Quadrant | BADHDUFLAG | Total packets | Discarded packets |
| A | 0 | 202 | 0 |
| B | 0 | 202 | 0 |
| C | 0 | 202 | 0 |
| D | 0 | 202 | 0 |
| Mode SS | |||
|---|---|---|---|
| Quadrant | BADHDUFLAG | Total packets | Discarded packets |
| A | 0 | 2558 | 0 |
| B | 0 | 2558 | 0 |
| C | 0 | 2558 | 0 |
| D | 0 | 2558 | 0 |
| Mode M0 | |||
|---|---|---|---|
| Quadrant | BADHDUFLAG | Total packets | Discarded packets |
| A | 0 | 262818 | 0 |
| B | 0 | 265127 | 0 |
| C | 0 | 261636 | 0 |
| D | 0 | 321619 | 0 |
| Quadrant | Total seconds | Saturated seconds | Saturation percentage |
|---|---|---|---|
| A | 125328 | 1498 | 1.195264% |
| B | 125332 | 2311 | 1.843903% |
| C | 125330 | 2256 | 1.800048% |
| D | 125316 | 3536 | 2.821667% |
Noise dominated data is calculated using 1-second bins in cleaned event files. If a bin has >2000 counts, and if more than 50% of those come from <1% of pixels, then it is considered to be noise-dominated and hence unusable.
| Quadrant | # 1 sec bins | Bins with >0 counts | Bins with >2000 counts | High rate bins dominated by noise | Noise dominated (total time) | Noise dominated (detector-on time) | Marked lightcurve |
|---|---|---|---|---|---|---|---|
| A | 145863 | 125351 | 5 | 5 | 0.00% | 0.00% |  |
| B | 145863 | 125344 | 79 | 79 | 0.05% | 0.06% | 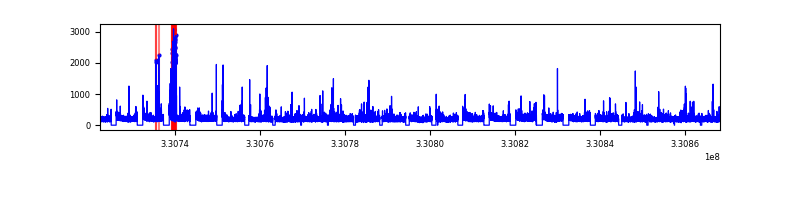 |
| C | 145863 | 125345 | 7 | 7 | 0.00% | 0.01% |  |
| D | 145863 | 125346 | 1258 | 1258 | 0.86% | 1.00% |  |
Top three noisy pixels from each quadrant. If the there are fewer than three noisy pixels in the level2.evt file, extra rows are filled as -1
| Pixel properties | Quadrant properties | ||||||
|---|---|---|---|---|---|---|---|
| Quadrant | DetID | PixID | Counts | Sigma | Mean | Median | Sigma |
| A | 8 | 192 | 3398991 | 2349.7 | 6750 | 6657 | 1443.7 |
| A | 13 | 254 | 178716 | 119.18 | 6750 | 6657 | 1443.7 |
| A | 13 | 170 | 118436 | 77.42 | 6750 | 6657 | 1443.7 |
| B | 3 | 64 | 1044857 | 818.17 | 6847 | 6703 | 1268.9 |
| B | 3 | 112 | 236234 | 180.89 | 6847 | 6703 | 1268.9 |
| B | 0 | 245 | 203765 | 155.3 | 6847 | 6703 | 1268.9 |
| C | 3 | 233 | 988875 | 639.34 | 6536 | 6524 | 1536.5 |
| C | 2 | 16 | 60607 | 35.2 | 6536 | 6524 | 1536.5 |
| C | 13 | 61 | 37623 | 20.24 | 6536 | 6524 | 1536.5 |
| D | 8 | 195 | 10936733 | 6479.61 | 6522 | 6357 | 1686.9 |
| D | 1 | 52 | 10626773 | 6295.86 | 6522 | 6357 | 1686.9 |
| D | 2 | 244 | 553944 | 324.61 | 6522 | 6357 | 1686.9 |
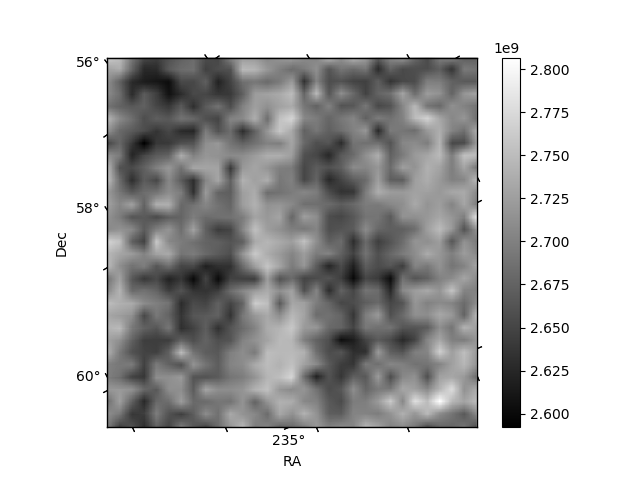
Histogram calculated using DETX and DETY for each event in the final _common_clean file
| Quadrant A |  |
 |
Quadrant B |
|---|---|---|---|
| Quadrant D | 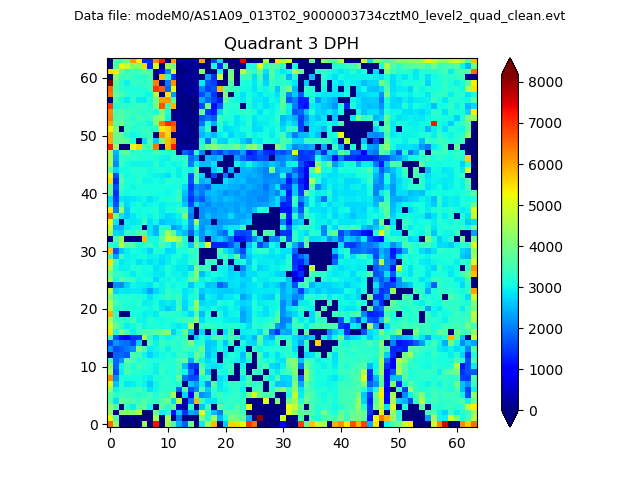 |
 |
Quadrant C |
| Plot type | Count rate plots | Images |
|---|---|---|
| Comparison with Poisson distribution Blue bars denote a histogram of data divided into 1 sec bins. Red curve is a Poisson curve with rate = median count rate of data. |
 |
 |
| Quadrant-wise count rates Data is divided into 100 sec bins |
 |
|
| Module-wise count rates for Quadrant A Data is divided into 100 sec bins |
 |
 |
| Module-wise count rates for Quadrant B Data is divided into 100 sec bins |
 |
 |
| Module-wise count rates for Quadrant C Data is divided into 100 sec bins |
 |
 |
| Module-wise count rates for Quadrant D Data is divided into 100 sec bins |
 |
 |
| Parameter | Plot |
|---|---|
| CZT HV Monitor |  |
| D_VDD |  |
| Temperature 1 |  |
| Veto HV Monitor |  |
| Veto LLD |  |
| Alpha Counter |  |
| _CPM_Rate |  |
| CZT Counter |  |
| +2.5 Volts monitor |  |
| +5 Volts monitor |  |
| _ROLL_ROT | 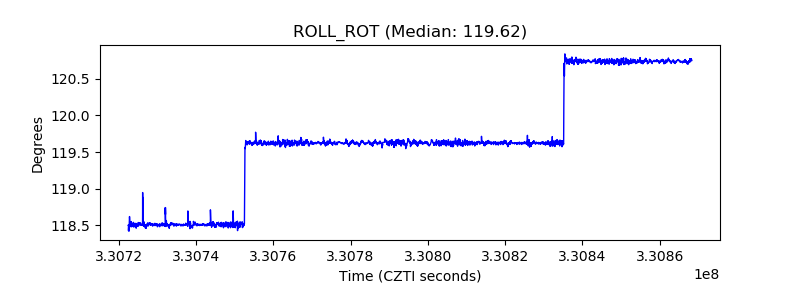 |
| _Roll_DEC |  |
| _Roll_RA |  |
| Veto Counter |  |