| Param | Original file | Final file |
|---|---|---|
| Filename | modeM0/AS1A07_148T02_9000003728cztM0_level2_bc.evt | modeM0/AS1A07_148T02_9000003728cztM0_level2_quad_clean.evt |
| Size (bytes) | 3,052,080,000 | 941,503,680 |
| Size | 2.8 GB | 897.9 MB |
| Events in quadrant A | 24,537,549 | 5,992,998 |
| Events in quadrant B | 17,265,238 | 6,105,537 |
| Events in quadrant C | 15,717,304 | 5,727,136 |
| Events in quadrant D | 29,805,358 | 5,547,202 |
| Mode M9 | |||
|---|---|---|---|
| Quadrant | BADHDUFLAG | Total packets | Discarded packets |
| A | 0 | 122 | 0 |
| B | 0 | 122 | 0 |
| C | 0 | 122 | 0 |
| D | 0 | 122 | 0 |
| Mode M0 | |||
|---|---|---|---|
| Quadrant | BADHDUFLAG | Total packets | Discarded packets |
| A | 0 | 187829 | 0 |
| B | 0 | 159152 | 0 |
| C | 0 | 157434 | 0 |
| D | 0 | 200214 | 0 |
| Mode SS | |||
|---|---|---|---|
| Quadrant | BADHDUFLAG | Total packets | Discarded packets |
| A | 0 | 1526 | 0 |
| B | 0 | 1526 | 0 |
| C | 0 | 1528 | 0 |
| D | 0 | 1528 | 0 |
| Quadrant | Total seconds | Saturated seconds | Saturation percentage |
|---|---|---|---|
| A | 75044 | 1426 | 1.900219% |
| B | 75044 | 1090 | 1.452481% |
| C | 75044 | 1443 | 1.922872% |
| D | 75045 | 2493 | 3.322007% |
Noise dominated data is calculated using 1-second bins in cleaned event files. If a bin has >2000 counts, and if more than 50% of those come from <1% of pixels, then it is considered to be noise-dominated and hence unusable.
| Quadrant | # 1 sec bins | Bins with >0 counts | Bins with >2000 counts | High rate bins dominated by noise | Noise dominated (total time) | Noise dominated (detector-on time) | Marked lightcurve |
|---|---|---|---|---|---|---|---|
| A | 87150 | 75046 | 93 | 93 | 0.11% | 0.12% |  |
| B | 87150 | 75047 | 3 | 3 | 0.00% | 0.00% | 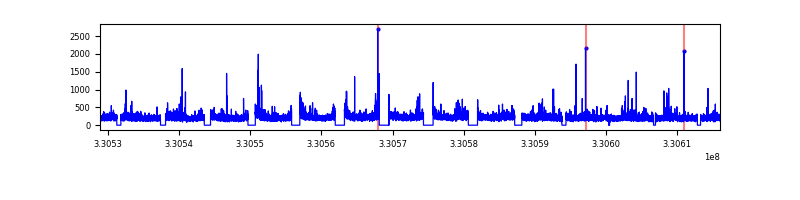 |
| C | 87150 | 75047 | 9 | 9 | 0.01% | 0.01% |  |
| D | 87151 | 75048 | 534 | 534 | 0.61% | 0.71% |  |
Top three noisy pixels from each quadrant. If the there are fewer than three noisy pixels in the level2.evt file, extra rows are filled as -1
| Pixel properties | Quadrant properties | ||||||
|---|---|---|---|---|---|---|---|
| Quadrant | DetID | PixID | Counts | Sigma | Mean | Median | Sigma |
| A | 8 | 192 | 5818057 | 6554.18 | 4148 | 4086 | 887.1 |
| A | 6 | 16 | 1832748 | 2061.48 | 4148 | 4086 | 887.1 |
| A | 0 | 13 | 747617 | 838.19 | 4148 | 4086 | 887.1 |
| B | 0 | 219 | 658753 | 829.12 | 4208 | 4111 | 789.6 |
| B | 0 | 190 | 165553 | 204.47 | 4208 | 4111 | 789.6 |
| B | 0 | 245 | 119262 | 145.84 | 4208 | 4111 | 789.6 |
| C | 3 | 233 | 363491 | 393.43 | 3936 | 3917 | 913.9 |
| C | 0 | 207 | 111817 | 118.06 | 3936 | 3917 | 913.9 |
| C | 5 | 112 | 77416 | 80.42 | 3936 | 3917 | 913.9 |
| D | 1 | 52 | 9620348 | 10480.9 | 3988 | 3850 | 917.5 |
| D | 8 | 195 | 2111181 | 2296.75 | 3988 | 3850 | 917.5 |
| D | 13 | 174 | 830692 | 901.16 | 3988 | 3850 | 917.5 |
Histogram calculated using DETX and DETY for each event in the final _common_clean file
| Quadrant A |  |
 |
Quadrant B |
|---|---|---|---|
| Quadrant D |  |
 |
Quadrant C |
| Plot type | Count rate plots | Images |
|---|---|---|
| Comparison with Poisson distribution Blue bars denote a histogram of data divided into 1 sec bins. Red curve is a Poisson curve with rate = median count rate of data. |
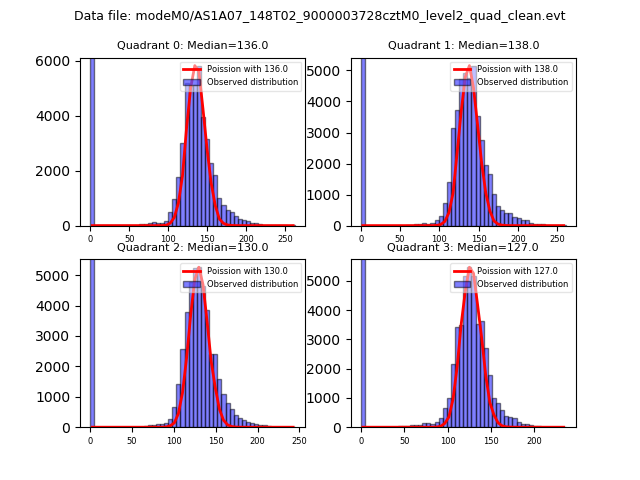 |
 |
| Quadrant-wise count rates Data is divided into 100 sec bins |
 |
|
| Module-wise count rates for Quadrant A Data is divided into 100 sec bins |
 |
 |
| Module-wise count rates for Quadrant B Data is divided into 100 sec bins |
 |
 |
| Module-wise count rates for Quadrant C Data is divided into 100 sec bins |
 |
 |
| Module-wise count rates for Quadrant D Data is divided into 100 sec bins |
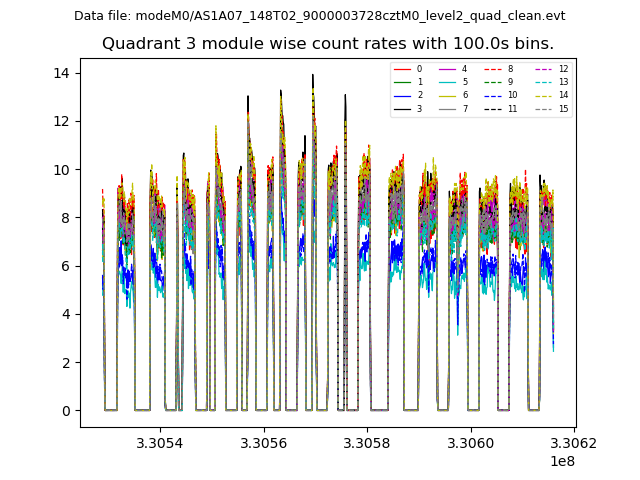 |
 |
| Parameter | Plot |
|---|---|
| CZT HV Monitor |  |
| D_VDD | 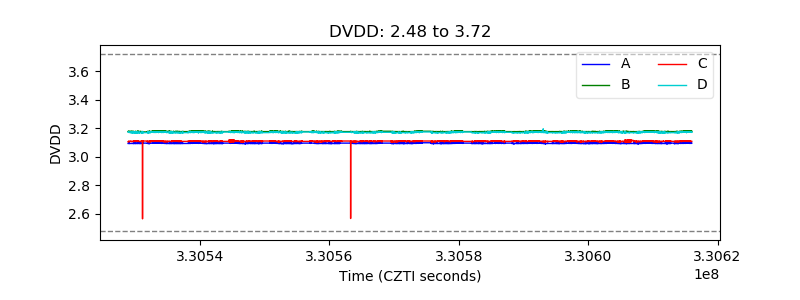 |
| Temperature 1 |  |
| Veto HV Monitor |  |
| Veto LLD |  |
| Alpha Counter | 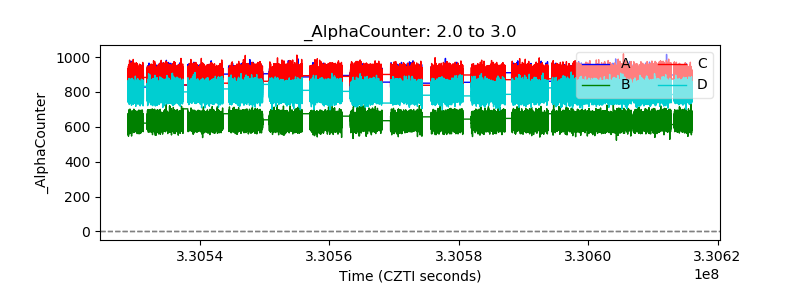 |
| _CPM_Rate | 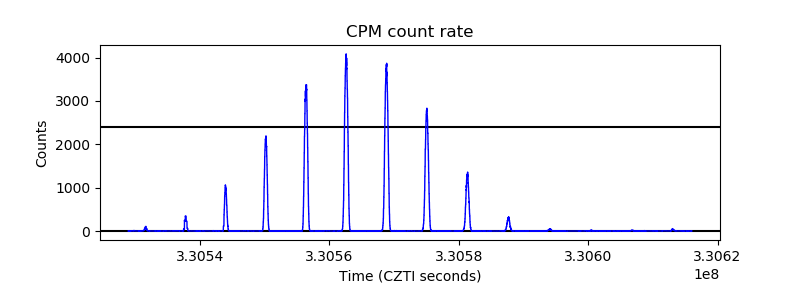 |
| CZT Counter |  |
| +2.5 Volts monitor |  |
| +5 Volts monitor |  |
| _ROLL_ROT | 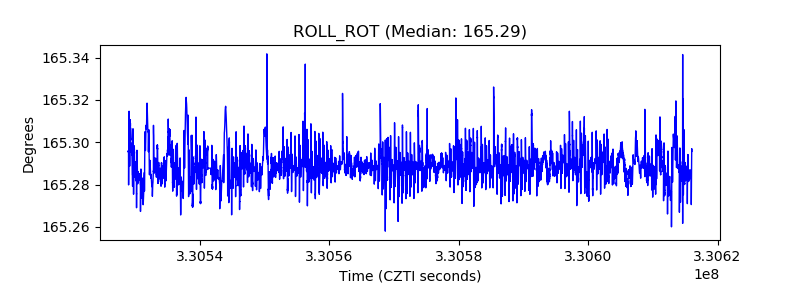 |
| _Roll_DEC | 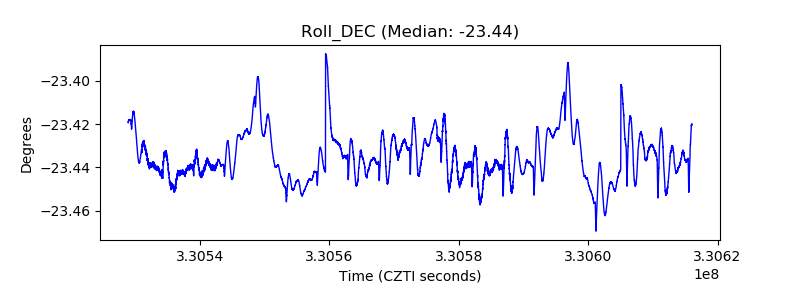 |
| _Roll_RA | 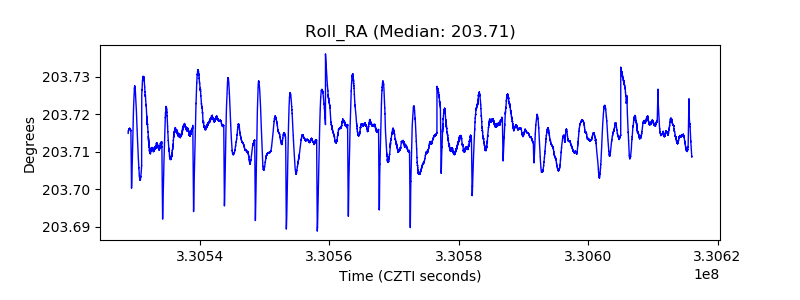 |
| Veto Counter |  |