| Param | Original file | Final file |
|---|---|---|
| Filename | modeM0/AS1A09_043T02_9000003726cztM0_level2_bc.evt | modeM0/AS1A09_043T02_9000003726cztM0_level2_quad_clean.evt |
| Size (bytes) | 8,338,383,360 | 2,513,433,600 |
| Size | 7.8 GB | 2.3 GB |
| Events in quadrant A | 50,636,000 | 16,261,210 |
| Events in quadrant B | 46,640,549 | 16,522,141 |
| Events in quadrant C | 41,695,473 | 15,430,206 |
| Events in quadrant D | 100,366,122 | 14,625,181 |
| Mode M0 | |||
|---|---|---|---|
| Quadrant | BADHDUFLAG | Total packets | Discarded packets |
| A | 0 | 433047 | 0 |
| B | 0 | 420002 | 0 |
| C | 0 | 411223 | 0 |
| D | 0 | 607121 | 0 |
| Mode M9 | |||
|---|---|---|---|
| Quadrant | BADHDUFLAG | Total packets | Discarded packets |
| A | 0 | 326 | 0 |
| B | 0 | 326 | 0 |
| C | 0 | 326 | 0 |
| D | 0 | 326 | 0 |
| Mode SS | |||
|---|---|---|---|
| Quadrant | BADHDUFLAG | Total packets | Discarded packets |
| A | 0 | 3948 | 0 |
| B | 0 | 3948 | 0 |
| C | 0 | 3948 | 0 |
| D | 0 | 3948 | 0 |
| Quadrant | Total seconds | Saturated seconds | Saturation percentage |
|---|---|---|---|
| A | 194049 | 4081 | 2.103077% |
| B | 194049 | 3294 | 1.697509% |
| C | 194049 | 3849 | 1.983520% |
| D | 194049 | 12521 | 6.452494% |
Noise dominated data is calculated using 1-second bins in cleaned event files. If a bin has >2000 counts, and if more than 50% of those come from <1% of pixels, then it is considered to be noise-dominated and hence unusable.
| Quadrant | # 1 sec bins | Bins with >0 counts | Bins with >2000 counts | High rate bins dominated by noise | Noise dominated (total time) | Noise dominated (detector-on time) | Marked lightcurve |
|---|---|---|---|---|---|---|---|
| A | 226387 | 194060 | 542 | 542 | 0.24% | 0.28% |  |
| B | 226387 | 194059 | 19 | 19 | 0.01% | 0.01% |  |
| C | 226387 | 194059 | 40 | 40 | 0.02% | 0.02% |  |
| D | 226387 | 194049 | 2446 | 2446 | 1.08% | 1.26% |  |
Top three noisy pixels from each quadrant. If the there are fewer than three noisy pixels in the level2.evt file, extra rows are filled as -1
| Pixel properties | Quadrant properties | ||||||
|---|---|---|---|---|---|---|---|
| Quadrant | DetID | PixID | Counts | Sigma | Mean | Median | Sigma |
| A | 8 | 192 | 4649509 | 1979.24 | 11012 | 10831 | 2343.7 |
| A | 6 | 16 | 2672219 | 1135.57 | 11012 | 10831 | 2343.7 |
| A | 10 | 17 | 441364 | 183.7 | 11012 | 10831 | 2343.7 |
| B | 0 | 219 | 1680605 | 813.24 | 11127 | 10894 | 2053.2 |
| B | 0 | 190 | 629573 | 301.33 | 11127 | 10894 | 2053.2 |
| B | 3 | 112 | 483796 | 230.33 | 11127 | 10894 | 2053.2 |
| C | 3 | 233 | 767531 | 315.48 | 10357 | 10341 | 2400.1 |
| C | 2 | 16 | 608925 | 249.4 | 10357 | 10341 | 2400.1 |
| C | 0 | 207 | 412385 | 167.51 | 10357 | 10341 | 2400.1 |
| D | 1 | 52 | 32332318 | 13371.68 | 10401 | 10043 | 2417.2 |
| D | 8 | 195 | 16125944 | 6667.13 | 10401 | 10043 | 2417.2 |
| D | 2 | 244 | 3441280 | 1419.5 | 10401 | 10043 | 2417.2 |
Histogram calculated using DETX and DETY for each event in the final _common_clean file
| Quadrant A |  |
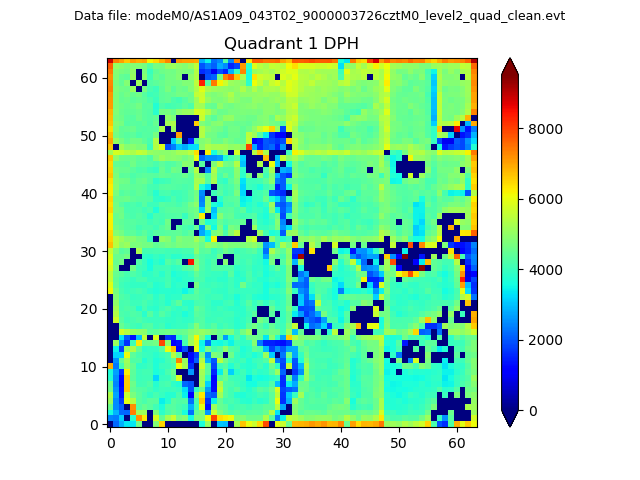 |
Quadrant B |
|---|---|---|---|
| Quadrant D |  |
 |
Quadrant C |
| Plot type | Count rate plots | Images |
|---|---|---|
| Comparison with Poisson distribution Blue bars denote a histogram of data divided into 1 sec bins. Red curve is a Poisson curve with rate = median count rate of data. |
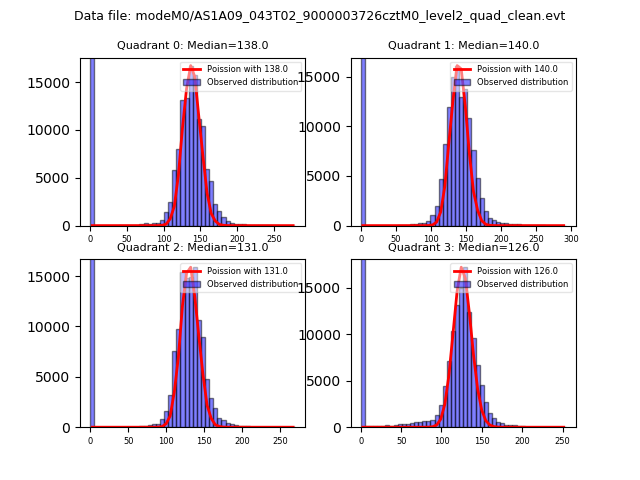 |
 |
| Quadrant-wise count rates Data is divided into 100 sec bins |
 |
|
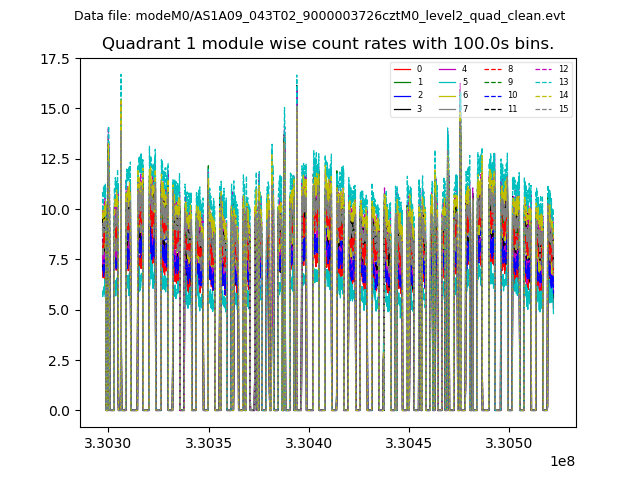
| Module-wise count rates for Quadrant A Data is divided into 100 sec bins |
 |
 |
| Module-wise count rates for Quadrant B Data is divided into 100 sec bins |
 |
 |
| Module-wise count rates for Quadrant C Data is divided into 100 sec bins |
 |
 |
| Module-wise count rates for Quadrant D Data is divided into 100 sec bins |
 |
 |
| Parameter | Plot |
|---|---|
| CZT HV Monitor | 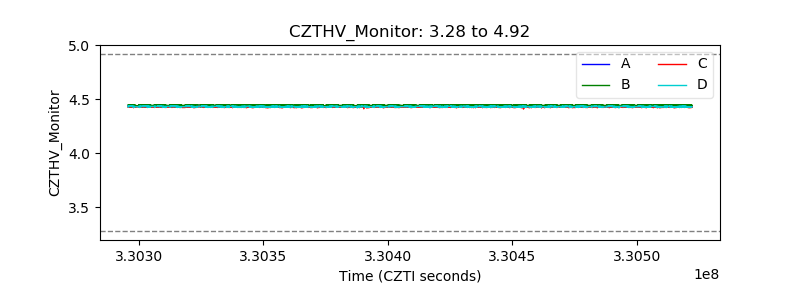 |
| D_VDD |  |
| Temperature 1 |  |
| Veto HV Monitor | 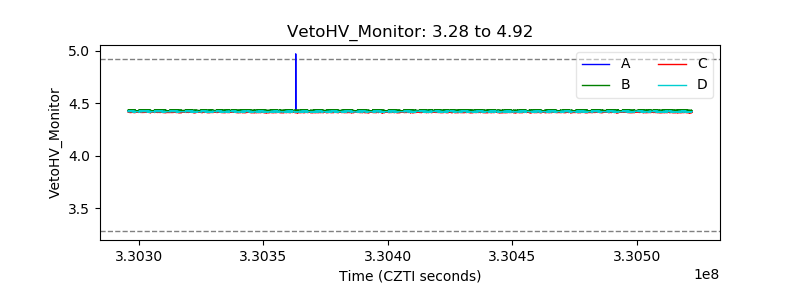 |
| Veto LLD |  |
| Alpha Counter |  |
| _CPM_Rate | 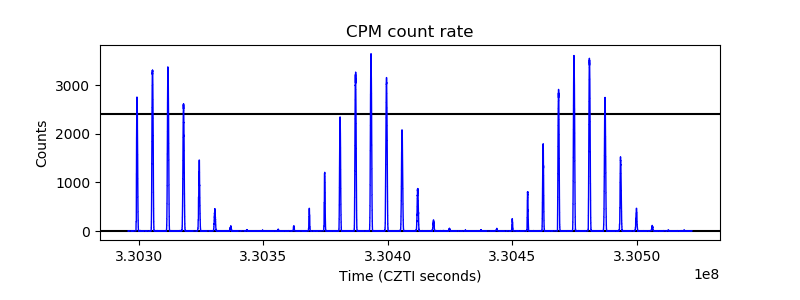 |
| CZT Counter | 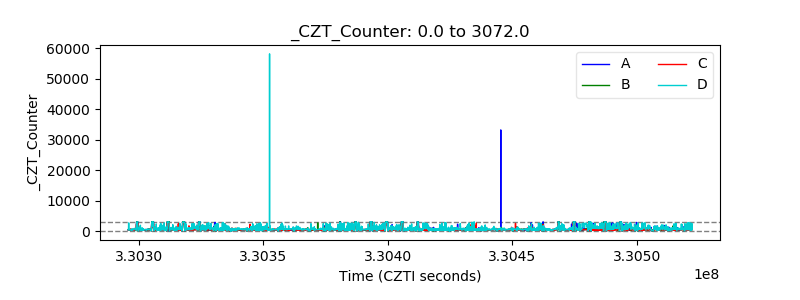 |
| +2.5 Volts monitor |  |
| +5 Volts monitor |  |
| _ROLL_ROT |  |
| _Roll_DEC |  |
| _Roll_RA |  |
| Veto Counter |  |