| Param | Original file | Final file |
|---|---|---|
| Filename | modeM0/AS1A07_147T01_9000003722cztM0_level2_bc.evt | modeM0/AS1A07_147T01_9000003722cztM0_level2_quad_clean.evt |
| Size (bytes) | 6,158,672,640 | 2,293,122,240 |
| Size | 5.7 GB | 2.1 GB |
| Events in quadrant A | 38,074,056 | 14,783,770 |
| Events in quadrant B | 39,167,545 | 14,909,006 |
| Events in quadrant C | 37,115,319 | 13,988,380 |
| Events in quadrant D | 60,149,126 | 13,695,505 |
| Mode SS | |||
|---|---|---|---|
| Quadrant | BADHDUFLAG | Total packets | Discarded packets |
| A | 0 | 3590 | 0 |
| B | 0 | 3590 | 0 |
| C | 0 | 3590 | 0 |
| D | 0 | 3590 | 0 |
| Mode M0 | |||
|---|---|---|---|
| Quadrant | BADHDUFLAG | Total packets | Discarded packets |
| A | 0 | 368943 | 0 |
| B | 0 | 373381 | 0 |
| C | 0 | 372290 | 0 |
| D | 0 | 435831 | 0 |
| Mode M9 | |||
|---|---|---|---|
| Quadrant | BADHDUFLAG | Total packets | Discarded packets |
| A | 0 | 276 | 0 |
| B | 0 | 276 | 0 |
| C | 0 | 276 | 0 |
| D | 0 | 276 | 0 |
| Quadrant | Total seconds | Saturated seconds | Saturation percentage |
|---|---|---|---|
| A | 176408 | 2523 | 1.430207% |
| B | 176408 | 3066 | 1.738016% |
| C | 176408 | 3627 | 2.056029% |
| D | 176408 | 4512 | 2.557707% |
Noise dominated data is calculated using 1-second bins in cleaned event files. If a bin has >2000 counts, and if more than 50% of those come from <1% of pixels, then it is considered to be noise-dominated and hence unusable.
| Quadrant | # 1 sec bins | Bins with >0 counts | Bins with >2000 counts | High rate bins dominated by noise | Noise dominated (total time) | Noise dominated (detector-on time) | Marked lightcurve |
|---|---|---|---|---|---|---|---|
| A | 203684 | 176417 | 0 | 0 | 0.00% | 0.00% |  |
| B | 203684 | 176413 | 8 | 8 | 0.00% | 0.00% |  |
| C | 203684 | 176412 | 27 | 27 | 0.01% | 0.02% |  |
| D | 203684 | 176412 | 732 | 732 | 0.36% | 0.41% |  |
Top three noisy pixels from each quadrant. If the there are fewer than three noisy pixels in the level2.evt file, extra rows are filled as -1
| Pixel properties | Quadrant properties | ||||||
|---|---|---|---|---|---|---|---|
| Quadrant | DetID | PixID | Counts | Sigma | Mean | Median | Sigma |
| A | 13 | 254 | 254433 | 116.55 | 9831 | 9665 | 2100.1 |
| A | 6 | 16 | 111719 | 48.59 | 9831 | 9665 | 2100.1 |
| A | 13 | 220 | 63196 | 25.49 | 9831 | 9665 | 2100.1 |
| B | 0 | 190 | 393356 | 206.74 | 9906 | 9682 | 1855.8 |
| B | 0 | 229 | 291374 | 151.79 | 9906 | 9682 | 1855.8 |
| B | 3 | 112 | 251367 | 130.23 | 9906 | 9682 | 1855.8 |
| C | 2 | 16 | 1055243 | 483.13 | 9281 | 9256 | 2165.0 |
| C | 3 | 233 | 305769 | 136.96 | 9281 | 9256 | 2165.0 |
| C | 7 | 247 | 70295 | 28.19 | 9281 | 9256 | 2165.0 |
| D | 1 | 52 | 13008917 | 5931.09 | 9470 | 9139 | 2191.8 |
| D | 8 | 195 | 7314498 | 3333.04 | 9470 | 9139 | 2191.8 |
| D | 12 | 233 | 1469520 | 666.29 | 9470 | 9139 | 2191.8 |
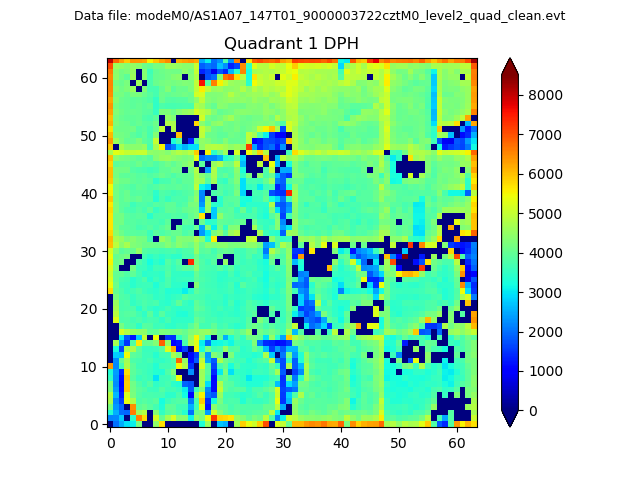
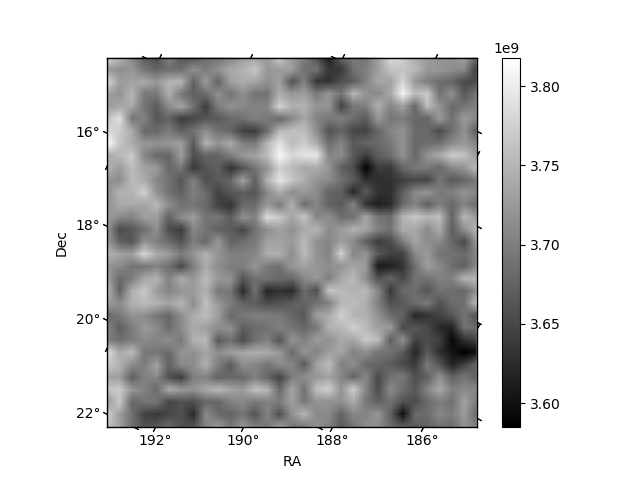
Histogram calculated using DETX and DETY for each event in the final _common_clean file
| Quadrant A |  |
 |
Quadrant B |
|---|---|---|---|
| Quadrant D |  |
 |
Quadrant C |
| Plot type | Count rate plots | Images |
|---|---|---|
| Comparison with Poisson distribution Blue bars denote a histogram of data divided into 1 sec bins. Red curve is a Poisson curve with rate = median count rate of data. |
 |
 |
| Quadrant-wise count rates Data is divided into 100 sec bins |
 |
|
| Module-wise count rates for Quadrant A Data is divided into 100 sec bins |
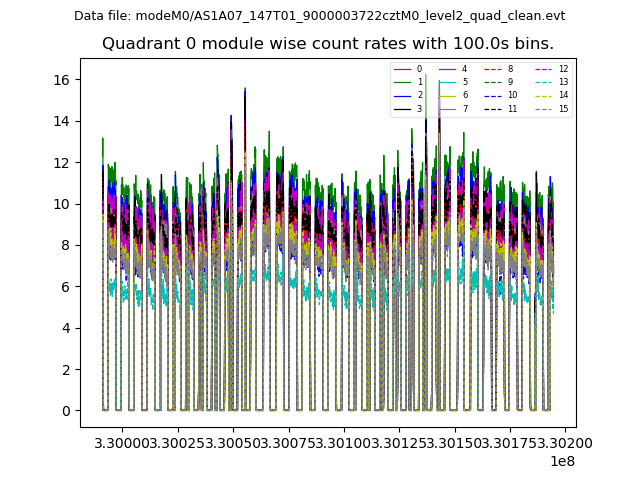 |
 |
| Module-wise count rates for Quadrant B Data is divided into 100 sec bins |
 |
 |
| Module-wise count rates for Quadrant C Data is divided into 100 sec bins |
 |
 |
| Module-wise count rates for Quadrant D Data is divided into 100 sec bins |
 |
 |
| Parameter | Plot |
|---|---|
| CZT HV Monitor |  |
| D_VDD |  |
| Temperature 1 |  |
| Veto HV Monitor |  |
| Veto LLD |  |
| Alpha Counter | 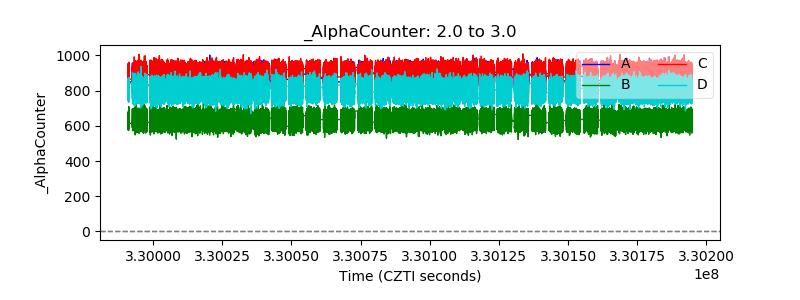 |
| _CPM_Rate |  |
| CZT Counter |  |
| +2.5 Volts monitor |  |
| +5 Volts monitor | 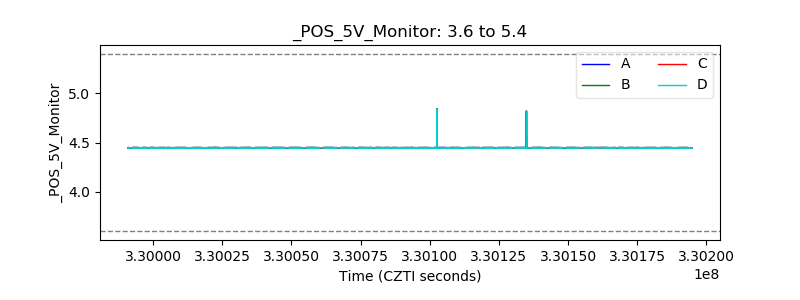 |
| _ROLL_ROT |  |
| _Roll_DEC | 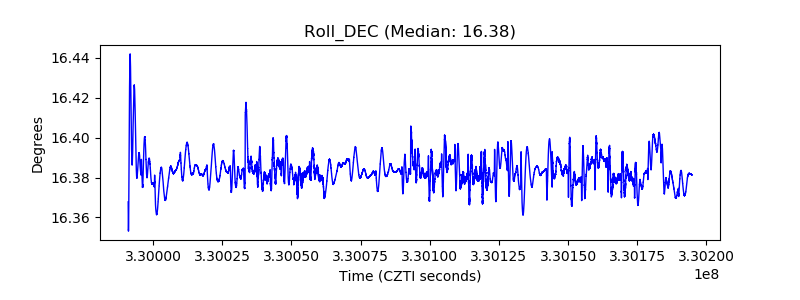 |
| _Roll_RA |  |
| Veto Counter |  |