| Param | Original file | Final file |
|---|---|---|
| Filename | modeM0/AS1A08_003T17_9000003720cztM0_level2_bc.evt | modeM0/AS1A08_003T17_9000003720cztM0_level2_quad_clean.evt |
| Size (bytes) | 2,408,883,840 | 761,535,360 |
| Size | 2.2 GB | 726.3 MB |
| Events in quadrant A | 13,234,522 | 4,914,870 |
| Events in quadrant B | 19,863,037 | 4,786,540 |
| Events in quadrant C | 12,641,349 | 4,663,199 |
| Events in quadrant D | 23,064,479 | 4,522,572 |
| Mode M0 | |||
|---|---|---|---|
| Quadrant | BADHDUFLAG | Total packets | Discarded packets |
| A | 0 | 127643 | 0 |
| B | 0 | 154887 | 0 |
| C | 0 | 127634 | 0 |
| D | 0 | 159164 | 0 |
| Mode M9 | |||
|---|---|---|---|
| Quadrant | BADHDUFLAG | Total packets | Discarded packets |
| A | 0 | 94 | 0 |
| B | 0 | 94 | 0 |
| C | 0 | 94 | 0 |
| D | 0 | 94 | 0 |
| Mode SS | |||
|---|---|---|---|
| Quadrant | BADHDUFLAG | Total packets | Discarded packets |
| A | 0 | 1242 | 0 |
| B | 0 | 1242 | 0 |
| C | 0 | 1242 | 0 |
| D | 0 | 1242 | 0 |
| Quadrant | Total seconds | Saturated seconds | Saturation percentage |
|---|---|---|---|
| A | 60905 | 591 | 0.970364% |
| B | 60905 | 3597 | 5.905919% |
| C | 60905 | 938 | 1.540103% |
| D | 60905 | 1390 | 2.282243% |
Noise dominated data is calculated using 1-second bins in cleaned event files. If a bin has >2000 counts, and if more than 50% of those come from <1% of pixels, then it is considered to be noise-dominated and hence unusable.
| Quadrant | # 1 sec bins | Bins with >0 counts | Bins with >2000 counts | High rate bins dominated by noise | Noise dominated (total time) | Noise dominated (detector-on time) | Marked lightcurve |
|---|---|---|---|---|---|---|---|
| A | 70430 | 60910 | 0 | 0 | 0.00% | 0.00% | 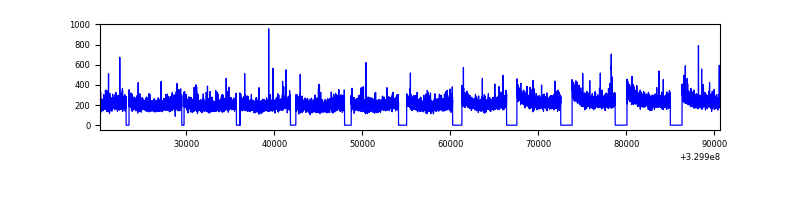 |
| B | 70430 | 60898 | 378 | 378 | 0.54% | 0.62% |  |
| C | 70430 | 60907 | 5 | 5 | 0.01% | 0.01% |  |
| D | 70430 | 60906 | 75 | 75 | 0.11% | 0.12% | 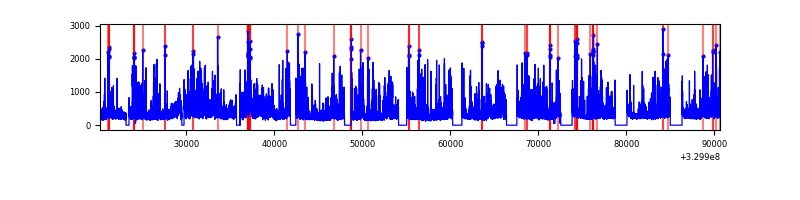 |
Top three noisy pixels from each quadrant. If the there are fewer than three noisy pixels in the level2.evt file, extra rows are filled as -1
| Pixel properties | Quadrant properties | ||||||
|---|---|---|---|---|---|---|---|
| Quadrant | DetID | PixID | Counts | Sigma | Mean | Median | Sigma |
| A | 13 | 254 | 84593 | 111.06 | 3420 | 3366 | 731.4 |
| A | 13 | 220 | 31231 | 38.1 | 3420 | 3366 | 731.4 |
| A | 0 | 226 | 21920 | 25.37 | 3420 | 3366 | 731.4 |
| B | 3 | 64 | 6335302 | 10105.28 | 3364 | 3296 | 626.6 |
| B | 0 | 190 | 162366 | 253.86 | 3364 | 3296 | 626.6 |
| B | 0 | 229 | 150309 | 234.62 | 3364 | 3296 | 626.6 |
| C | 2 | 16 | 101431 | 129.78 | 3228 | 3218 | 756.7 |
| C | 3 | 233 | 48887 | 60.35 | 3228 | 3218 | 756.7 |
| C | 0 | 239 | 30376 | 35.89 | 3228 | 3218 | 756.7 |
| D | 1 | 52 | 4309373 | 5708.79 | 3288 | 3178 | 754.3 |
| D | 8 | 195 | 3354296 | 4442.63 | 3288 | 3178 | 754.3 |
| D | 7 | 238 | 1327624 | 1755.84 | 3288 | 3178 | 754.3 |
Histogram calculated using DETX and DETY for each event in the final _common_clean file
| Quadrant A |  |
 |
Quadrant B |
|---|---|---|---|
| Quadrant D |  |
 |
Quadrant C |
| Plot type | Count rate plots | Images |
|---|---|---|
| Comparison with Poisson distribution Blue bars denote a histogram of data divided into 1 sec bins. Red curve is a Poisson curve with rate = median count rate of data. |
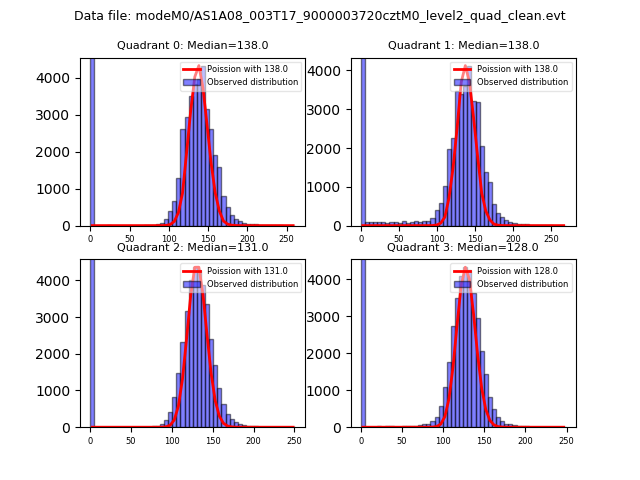 |
 |
| Quadrant-wise count rates Data is divided into 100 sec bins |
 |
|
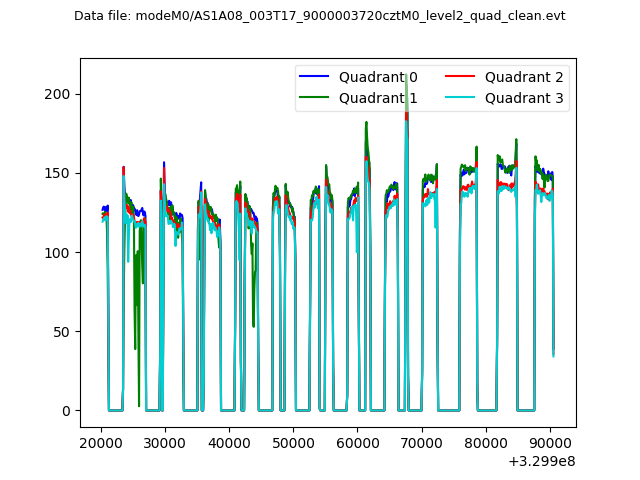
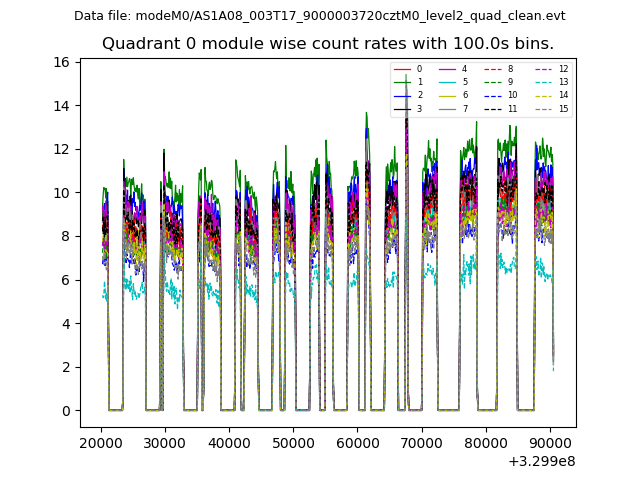
| Module-wise count rates for Quadrant A Data is divided into 100 sec bins |
 |
 |
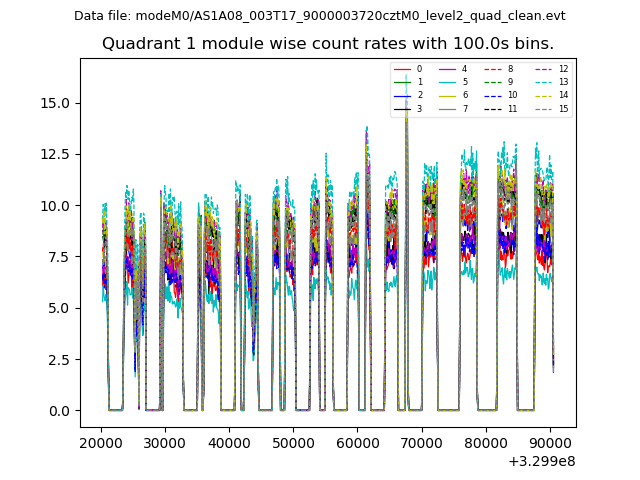
| Module-wise count rates for Quadrant B Data is divided into 100 sec bins |
 |
 |
| Module-wise count rates for Quadrant C Data is divided into 100 sec bins |
 |
 |
| Module-wise count rates for Quadrant D Data is divided into 100 sec bins |
 |
 |
| Parameter | Plot |
|---|---|
| CZT HV Monitor | 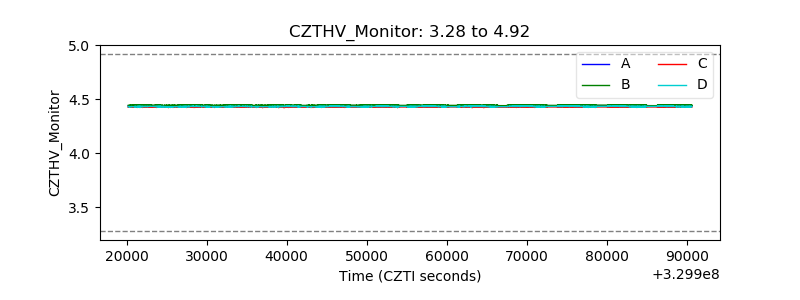 |
| D_VDD |  |
| Temperature 1 |  |
| Veto HV Monitor |  |
| Veto LLD | 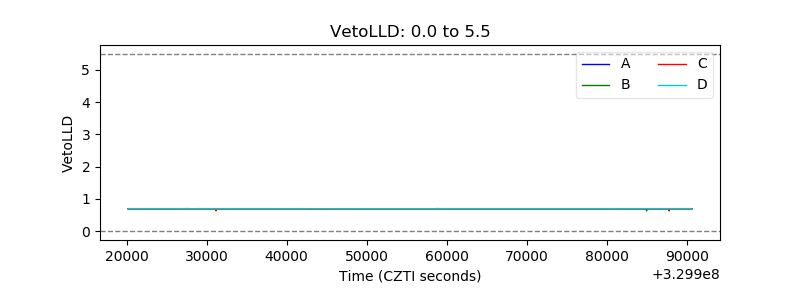 |
| Alpha Counter |  |
| _CPM_Rate |  |
| CZT Counter |  |
| +2.5 Volts monitor |  |
| +5 Volts monitor |  |
| _ROLL_ROT |  |
| _Roll_DEC |  |
| _Roll_RA |  |
| Veto Counter |  |