| Param | Original file | Final file |
|---|---|---|
| Filename | modeM0/AS1A09_085T02_9000003716cztM0_level2_bc.evt | modeM0/AS1A09_085T02_9000003716cztM0_level2_quad_clean.evt |
| Size (bytes) | 7,908,223,680 | 2,841,131,520 |
| Size | 7.4 GB | 2.6 GB |
| Events in quadrant A | 48,904,293 | 18,619,922 |
| Events in quadrant B | 44,465,664 | 18,699,315 |
| Events in quadrant C | 47,231,500 | 17,917,431 |
| Events in quadrant D | 85,248,813 | 17,080,066 |
| Mode M9 | |||
|---|---|---|---|
| Quadrant | BADHDUFLAG | Total packets | Discarded packets |
| A | 0 | 328 | 0 |
| B | 0 | 328 | 0 |
| C | 0 | 328 | 0 |
| D | 0 | 328 | 0 |
| Mode M0 | |||
|---|---|---|---|
| Quadrant | BADHDUFLAG | Total packets | Discarded packets |
| A | 0 | 437276 | 0 |
| B | 0 | 423439 | 0 |
| C | 0 | 442905 | 0 |
| D | 0 | 576838 | 0 |
| Mode SS | |||
|---|---|---|---|
| Quadrant | BADHDUFLAG | Total packets | Discarded packets |
| A | 0 | 4088 | 0 |
| B | 0 | 4088 | 0 |
| C | 0 | 4088 | 0 |
| D | 0 | 4088 | 0 |
| Quadrant | Total seconds | Saturated seconds | Saturation percentage |
|---|---|---|---|
| A | 200633 | 2026 | 1.009804% |
| B | 200633 | 2424 | 1.208176% |
| C | 200633 | 4588 | 2.286762% |
| D | 200633 | 13571 | 6.764092% |
Noise dominated data is calculated using 1-second bins in cleaned event files. If a bin has >2000 counts, and if more than 50% of those come from <1% of pixels, then it is considered to be noise-dominated and hence unusable.
| Quadrant | # 1 sec bins | Bins with >0 counts | Bins with >2000 counts | High rate bins dominated by noise | Noise dominated (total time) | Noise dominated (detector-on time) | Marked lightcurve |
|---|---|---|---|---|---|---|---|
| A | 233418 | 200642 | 28 | 28 | 0.01% | 0.01% |  |
| B | 233418 | 200631 | 3 | 3 | 0.00% | 0.00% |  |
| C | 233418 | 200637 | 47 | 47 | 0.02% | 0.02% |  |
| D | 233418 | 200630 | 2011 | 2011 | 0.86% | 1.00% | 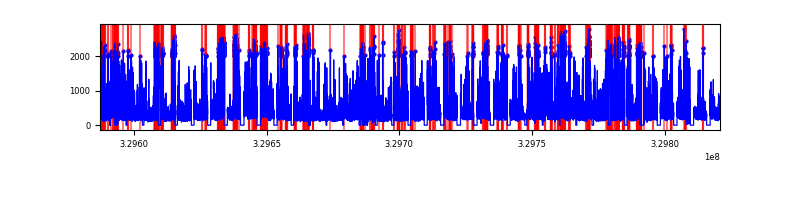 |
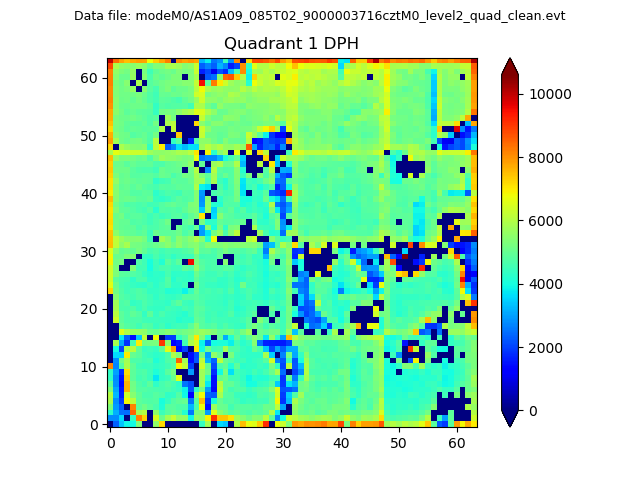
Top three noisy pixels from each quadrant. If the there are fewer than three noisy pixels in the level2.evt file, extra rows are filled as -1
| Pixel properties | Quadrant properties | ||||||
|---|---|---|---|---|---|---|---|
| Quadrant | DetID | PixID | Counts | Sigma | Mean | Median | Sigma |
| A | 6 | 16 | 5113328 | 2099.35 | 11336 | 11162 | 2430.4 |
| A | 13 | 254 | 285488 | 112.87 | 11336 | 11162 | 2430.4 |
| A | 0 | 226 | 73389 | 25.6 | 11336 | 11162 | 2430.4 |
| B | 0 | 190 | 306788 | 139.87 | 11284 | 11038 | 2114.5 |
| B | 3 | 112 | 295314 | 134.44 | 11284 | 11038 | 2114.5 |
| B | 0 | 245 | 260498 | 117.98 | 11284 | 11038 | 2114.5 |
| C | 9 | 54 | 3951232 | 1576.3 | 10763 | 10742 | 2499.8 |
| C | 2 | 16 | 1014394 | 401.49 | 10763 | 10742 | 2499.8 |
| C | 7 | 87 | 720567 | 283.95 | 10763 | 10742 | 2499.8 |
| D | 1 | 52 | 19228113 | 7815.08 | 10781 | 10435 | 2459.1 |
| D | 7 | 238 | 13526809 | 5496.58 | 10781 | 10435 | 2459.1 |
| D | 8 | 195 | 5859034 | 2378.4 | 10781 | 10435 | 2459.1 |
Histogram calculated using DETX and DETY for each event in the final _common_clean file
| Quadrant A |  |
 |
Quadrant B |
|---|---|---|---|
| Quadrant D |  |
 |
Quadrant C |
| Plot type | Count rate plots | Images |
|---|---|---|
| Comparison with Poisson distribution Blue bars denote a histogram of data divided into 1 sec bins. Red curve is a Poisson curve with rate = median count rate of data. |
 |
 |
| Quadrant-wise count rates Data is divided into 100 sec bins |
 |
|
| Module-wise count rates for Quadrant A Data is divided into 100 sec bins |
 |
 |
| Module-wise count rates for Quadrant B Data is divided into 100 sec bins |
 |
 |
| Module-wise count rates for Quadrant C Data is divided into 100 sec bins |
 |
 |
| Module-wise count rates for Quadrant D Data is divided into 100 sec bins |
 |
 |
| Parameter | Plot |
|---|---|
| CZT HV Monitor | 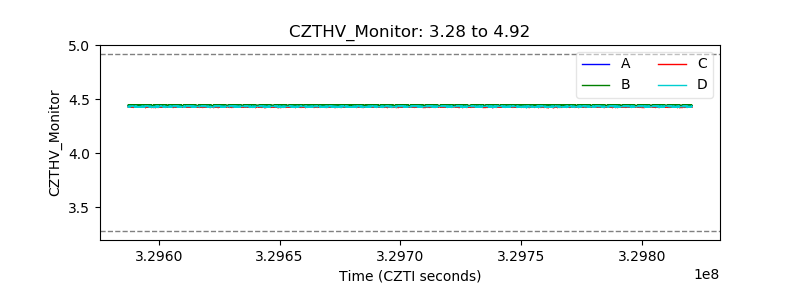 |
| D_VDD | 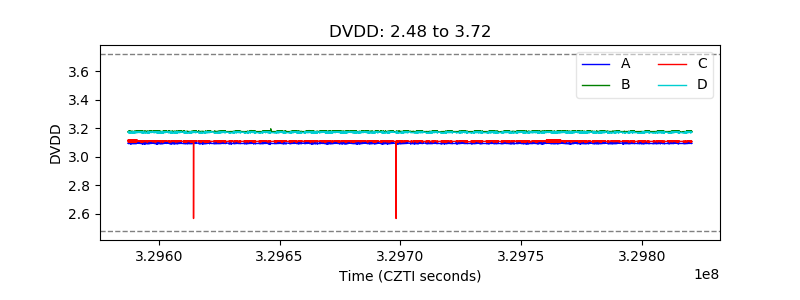 |
| Temperature 1 |  |
| Veto HV Monitor | 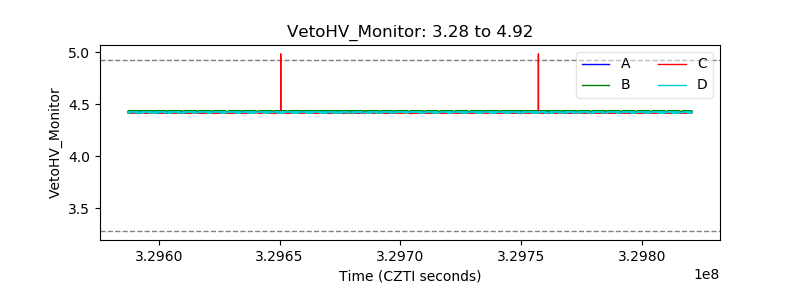 |
| Veto LLD |  |
| Alpha Counter |  |
| _CPM_Rate |  |
| CZT Counter |  |
| +2.5 Volts monitor | 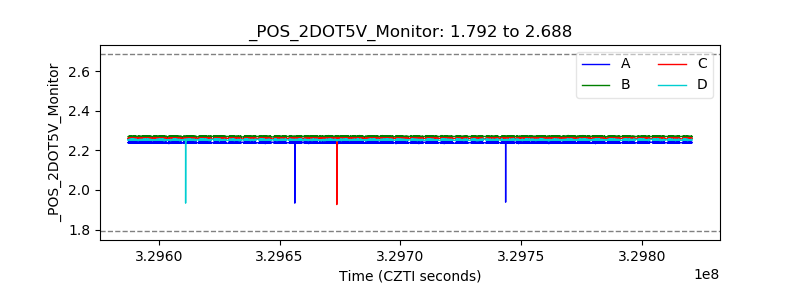 |
| +5 Volts monitor |  |
| _ROLL_ROT |  |
| _Roll_DEC |  |
| _Roll_RA |  |
| Veto Counter |  |