| Param | Original file | Final file |
|---|---|---|
| Filename | modeM0/AS1A09_047T01_9000003714cztM0_level2_bc.evt | modeM0/AS1A09_047T01_9000003714cztM0_level2_quad_clean.evt |
| Size (bytes) | 6,798,623,040 | 2,131,784,640 |
| Size | 6.3 GB | 2.0 GB |
| Events in quadrant A | 39,609,623 | 14,254,933 |
| Events in quadrant B | 34,743,686 | 14,300,729 |
| Events in quadrant C | 32,903,001 | 13,722,324 |
| Events in quadrant D | 88,519,201 | 12,093,984 |
| Mode SS | |||
|---|---|---|---|
| Quadrant | BADHDUFLAG | Total packets | Discarded packets |
| A | 0 | 3042 | 0 |
| B | 0 | 3042 | 0 |
| C | 0 | 3042 | 0 |
| D | 0 | 3042 | 0 |
| Mode M9 | |||
|---|---|---|---|
| Quadrant | BADHDUFLAG | Total packets | Discarded packets |
| A | 0 | 237 | 0 |
| B | 0 | 237 | 0 |
| C | 0 | 237 | 0 |
| D | 0 | 237 | 0 |
| Mode M0 | |||
|---|---|---|---|
| Quadrant | BADHDUFLAG | Total packets | Discarded packets |
| A | 0 | 333520 | 0 |
| B | 0 | 318383 | 0 |
| C | 0 | 318833 | 0 |
| D | 0 | 546019 | 0 |
| Quadrant | Total seconds | Saturated seconds | Saturation percentage |
|---|---|---|---|
| A | 148792 | 1683 | 1.131109% |
| B | 148792 | 1877 | 1.261493% |
| C | 148792 | 2504 | 1.682886% |
| D | 148792 | 21100 | 14.180870% |
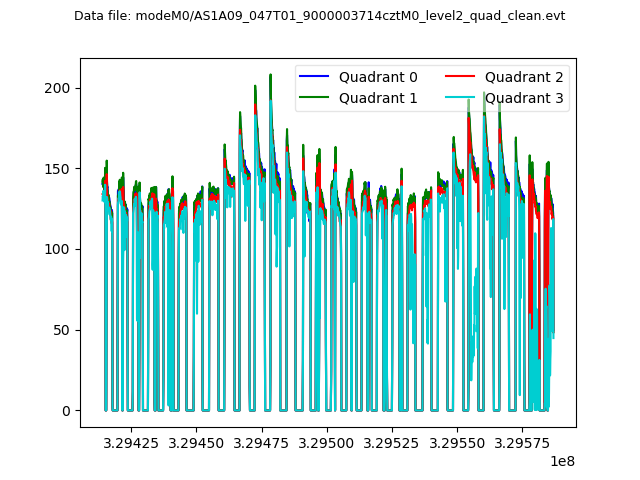
Noise dominated data is calculated using 1-second bins in cleaned event files. If a bin has >2000 counts, and if more than 50% of those come from <1% of pixels, then it is considered to be noise-dominated and hence unusable.
| Quadrant | # 1 sec bins | Bins with >0 counts | Bins with >2000 counts | High rate bins dominated by noise | Noise dominated (total time) | Noise dominated (detector-on time) | Marked lightcurve |
|---|---|---|---|---|---|---|---|
| A | 172942 | 148770 | 64 | 64 | 0.04% | 0.04% |  |
| B | 172942 | 148771 | 37 | 37 | 0.02% | 0.02% |  |
| C | 172942 | 148773 | 11 | 11 | 0.01% | 0.01% |  |
| D | 172942 | 148704 | 2927 | 2927 | 1.69% | 1.97% |  |
Top three noisy pixels from each quadrant. If the there are fewer than three noisy pixels in the level2.evt file, extra rows are filled as -1
| Pixel properties | Quadrant properties | ||||||
|---|---|---|---|---|---|---|---|
| Quadrant | DetID | PixID | Counts | Sigma | Mean | Median | Sigma |
| A | 6 | 16 | 6941635 | 3836.14 | 8419 | 8286 | 1807.4 |
| A | 13 | 254 | 216168 | 115.02 | 8419 | 8286 | 1807.4 |
| A | 4 | 2 | 117647 | 60.51 | 8419 | 8286 | 1807.4 |
| B | 3 | 112 | 1108565 | 707.26 | 8358 | 8176 | 1555.9 |
| B | 0 | 229 | 706796 | 449.03 | 8358 | 8176 | 1555.9 |
| B | 0 | 190 | 322746 | 202.18 | 8358 | 8176 | 1555.9 |
| C | 7 | 247 | 1751090 | 934.2 | 7979 | 7966 | 1865.9 |
| C | 2 | 16 | 173002 | 88.45 | 7979 | 7966 | 1865.9 |
| C | 7 | 87 | 127664 | 64.15 | 7979 | 7966 | 1865.9 |
| D | 1 | 52 | 29767780 | 17152.89 | 7543 | 7301 | 1735.0 |
| D | 8 | 195 | 14949980 | 8612.44 | 7543 | 7301 | 1735.0 |
| D | 7 | 238 | 7277171 | 4190.1 | 7543 | 7301 | 1735.0 |
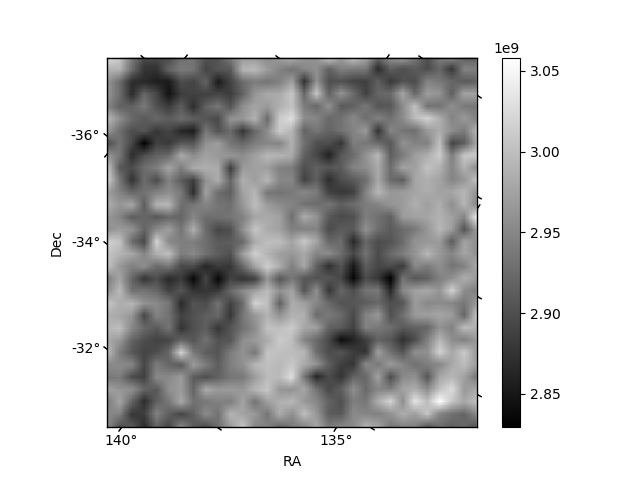
Histogram calculated using DETX and DETY for each event in the final _common_clean file
| Quadrant A |  |
 |
Quadrant B |
|---|---|---|---|
| Quadrant D |  |
 |
Quadrant C |
| Plot type | Count rate plots | Images |
|---|---|---|
| Comparison with Poisson distribution Blue bars denote a histogram of data divided into 1 sec bins. Red curve is a Poisson curve with rate = median count rate of data. |
 |
 |
| Quadrant-wise count rates Data is divided into 100 sec bins |
 |
|
| Module-wise count rates for Quadrant A Data is divided into 100 sec bins |
 |
 |
| Module-wise count rates for Quadrant B Data is divided into 100 sec bins |
 |
 |
| Module-wise count rates for Quadrant C Data is divided into 100 sec bins |
 |
 |
| Module-wise count rates for Quadrant D Data is divided into 100 sec bins |
 |
 |
| Parameter | Plot |
|---|---|
| CZT HV Monitor | 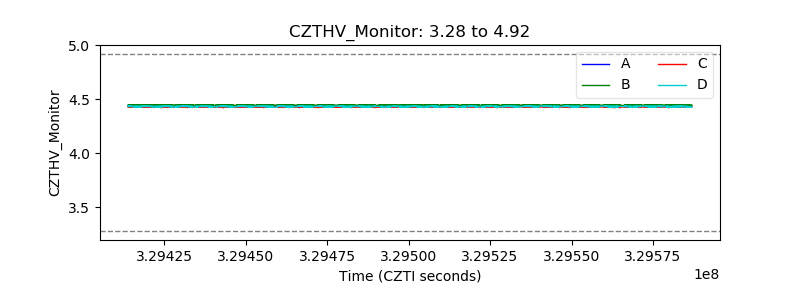 |
| D_VDD |  |
| Temperature 1 |  |
| Veto HV Monitor |  |
| Veto LLD |  |
| Alpha Counter |  |
| _CPM_Rate |  |
| CZT Counter |  |
| +2.5 Volts monitor |  |
| +5 Volts monitor |  |
| _ROLL_ROT |  |
| _Roll_DEC |  |
| _Roll_RA |  |
| Veto Counter | 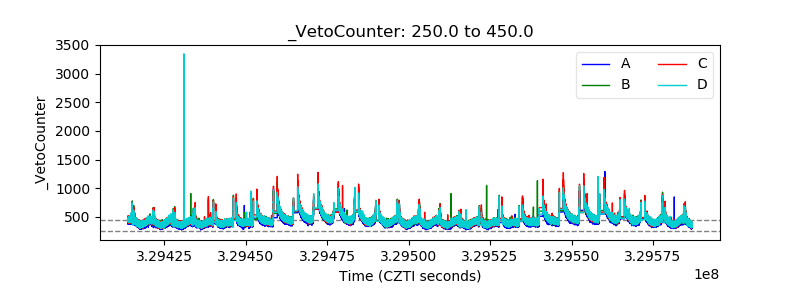 |