| Param | Original file | Final file |
|---|---|---|
| Filename | modeM0/AS1A09_057T04_9000003712cztM0_level2_bc.evt | modeM0/AS1A09_057T04_9000003712cztM0_level2_quad_clean.evt |
| Size (bytes) | 5,906,269,440 | 1,671,396,480 |
| Size | 5.5 GB | 1.6 GB |
| Events in quadrant A | 39,900,273 | 10,813,568 |
| Events in quadrant B | 30,222,434 | 10,927,162 |
| Events in quadrant C | 27,839,183 | 10,413,395 |
| Events in quadrant D | 72,282,975 | 9,774,034 |
| Mode M9 | |||
|---|---|---|---|
| Quadrant | BADHDUFLAG | Total packets | Discarded packets |
| A | 0 | 227 | 0 |
| B | 0 | 227 | 0 |
| C | 0 | 227 | 0 |
| D | 0 | 227 | 0 |
| Mode M0 | |||
|---|---|---|---|
| Quadrant | BADHDUFLAG | Total packets | Discarded packets |
| A | 0 | 303333 | 0 |
| B | 0 | 273132 | 0 |
| C | 0 | 269801 | 0 |
| D | 0 | 425597 | 0 |
| Mode SS | |||
|---|---|---|---|
| Quadrant | BADHDUFLAG | Total packets | Discarded packets |
| A | 0 | 2586 | 0 |
| B | 0 | 2586 | 0 |
| C | 0 | 2586 | 0 |
| D | 0 | 2586 | 0 |
| Quadrant | Total seconds | Saturated seconds | Saturation percentage |
|---|---|---|---|
| A | 126920 | 3057 | 2.408604% |
| B | 126920 | 1740 | 1.370942% |
| C | 126919 | 2067 | 1.628598% |
| D | 126920 | 12711 | 10.014970% |
Noise dominated data is calculated using 1-second bins in cleaned event files. If a bin has >2000 counts, and if more than 50% of those come from <1% of pixels, then it is considered to be noise-dominated and hence unusable.
| Quadrant | # 1 sec bins | Bins with >0 counts | Bins with >2000 counts | High rate bins dominated by noise | Noise dominated (total time) | Noise dominated (detector-on time) | Marked lightcurve |
|---|---|---|---|---|---|---|---|
| A | 149735 | 126911 | 1068 | 1068 | 0.71% | 0.84% | 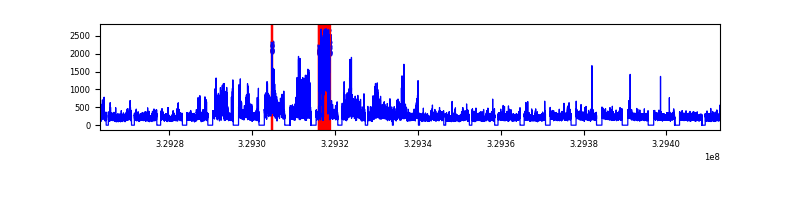 |
| B | 149735 | 126904 | 29 | 29 | 0.02% | 0.02% |  |
| C | 149735 | 126905 | 0 | 0 | 0.00% | 0.00% |  |
| D | 149735 | 126898 | 3701 | 3701 | 2.47% | 2.92% | 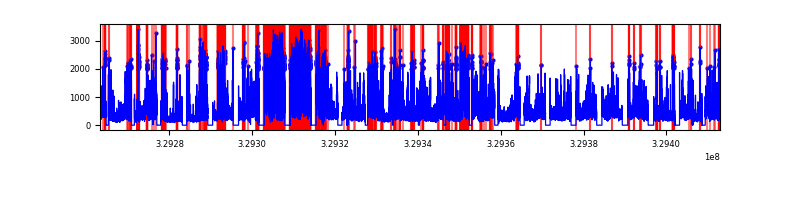 |
Top three noisy pixels from each quadrant. If the there are fewer than three noisy pixels in the level2.evt file, extra rows are filled as -1
| Pixel properties | Quadrant properties | ||||||
|---|---|---|---|---|---|---|---|
| Quadrant | DetID | PixID | Counts | Sigma | Mean | Median | Sigma |
| A | 6 | 16 | 11551694 | 7502.16 | 7214 | 7094 | 1538.8 |
| A | 15 | 173 | 487168 | 311.97 | 7214 | 7094 | 1538.8 |
| A | 13 | 254 | 168525 | 104.9 | 7214 | 7094 | 1538.8 |
| B | 3 | 112 | 1215644 | 912.84 | 7195 | 7043 | 1324.0 |
| B | 0 | 190 | 490154 | 364.89 | 7195 | 7043 | 1324.0 |
| B | 0 | 229 | 379711 | 281.47 | 7195 | 7043 | 1324.0 |
| C | 7 | 87 | 617578 | 375.88 | 6903 | 6893 | 1624.7 |
| C | 9 | 54 | 225268 | 134.41 | 6903 | 6893 | 1624.7 |
| C | 7 | 247 | 218237 | 130.08 | 6903 | 6893 | 1624.7 |
| D | 1 | 52 | 23843547 | 15157.26 | 6808 | 6596 | 1572.6 |
| D | 8 | 195 | 9958457 | 6328.11 | 6808 | 6596 | 1572.6 |
| D | 7 | 238 | 7773014 | 4938.45 | 6808 | 6596 | 1572.6 |
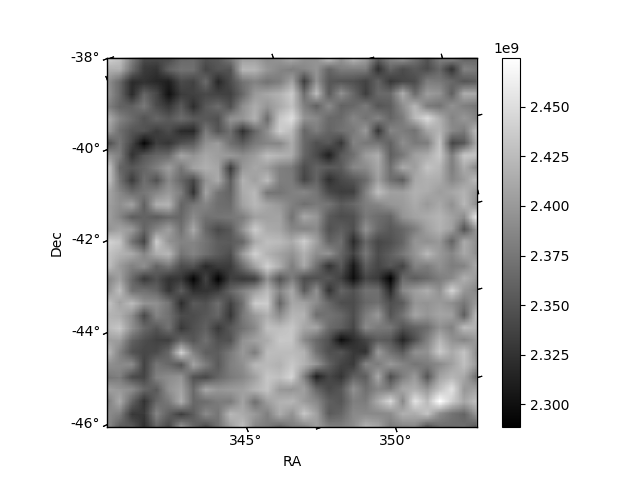
Histogram calculated using DETX and DETY for each event in the final _common_clean file
| Quadrant A |  |
 |
Quadrant B |
|---|---|---|---|
| Quadrant D |  |
 |
Quadrant C |
| Plot type | Count rate plots | Images |
|---|---|---|
| Comparison with Poisson distribution Blue bars denote a histogram of data divided into 1 sec bins. Red curve is a Poisson curve with rate = median count rate of data. |
 |
 |
| Quadrant-wise count rates Data is divided into 100 sec bins |
 |
|
| Module-wise count rates for Quadrant A Data is divided into 100 sec bins |
 |
 |
| Module-wise count rates for Quadrant B Data is divided into 100 sec bins |
 |
 |
| Module-wise count rates for Quadrant C Data is divided into 100 sec bins |
 |
 |
| Module-wise count rates for Quadrant D Data is divided into 100 sec bins |
 |
 |
| Parameter | Plot |
|---|---|
| CZT HV Monitor |  |
| D_VDD |  |
| Temperature 1 |  |
| Veto HV Monitor |  |
| Veto LLD |  |
| Alpha Counter | 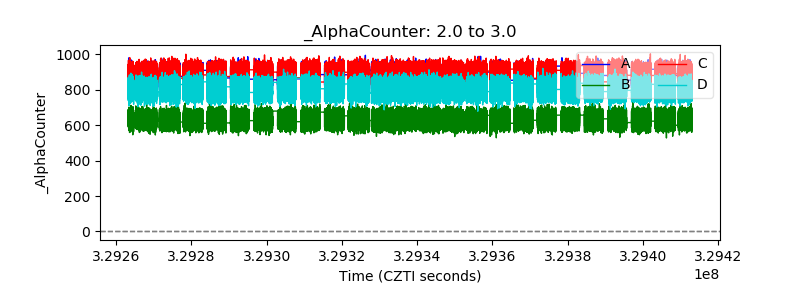 |
| _CPM_Rate | 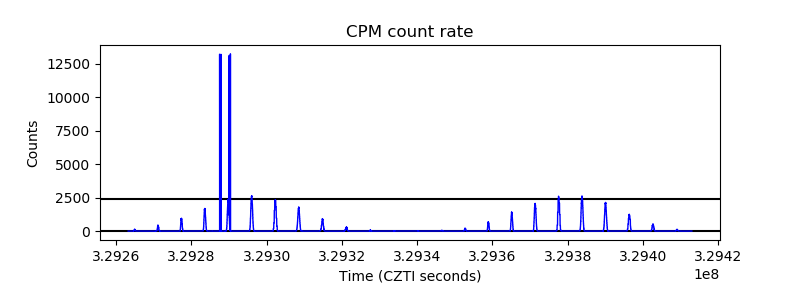 |
| CZT Counter |  |
| +2.5 Volts monitor | 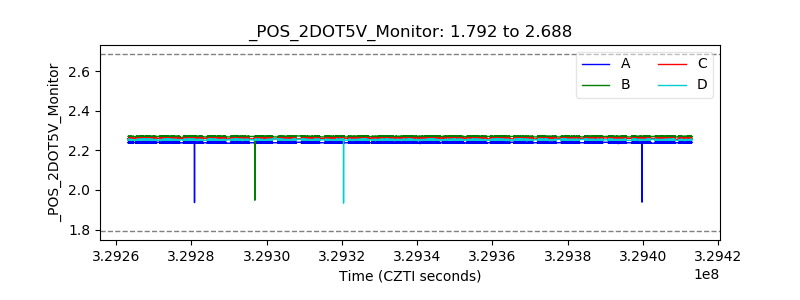 |
| +5 Volts monitor |  |
| _ROLL_ROT | 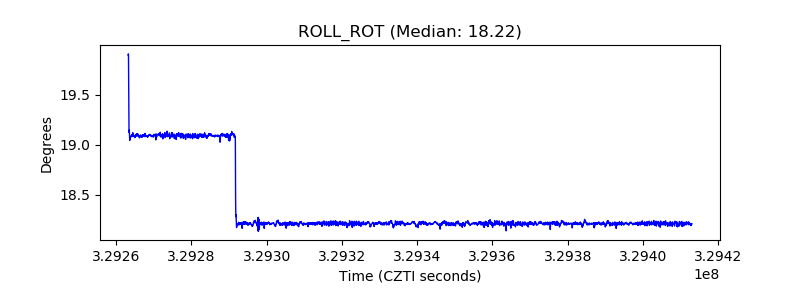 |
| _Roll_DEC |  |
| _Roll_RA |  |
| Veto Counter |  |