| Param | Original file | Final file |
|---|---|---|
| Filename | modeM0/AS1A09_104T01_9000003710cztM0_level2_bc.evt | modeM0/AS1A09_104T01_9000003710cztM0_level2_quad_clean.evt |
| Size (bytes) | 3,499,217,280 | 1,275,007,680 |
| Size | 3.3 GB | 1.2 GB |
| Events in quadrant A | 22,469,461 | 8,294,460 |
| Events in quadrant B | 20,484,325 | 8,314,347 |
| Events in quadrant C | 19,880,022 | 7,906,016 |
| Events in quadrant D | 36,801,299 | 7,726,276 |
| Mode SS | |||
|---|---|---|---|
| Quadrant | BADHDUFLAG | Total packets | Discarded packets |
| A | 0 | 1898 | 0 |
| B | 0 | 1898 | 0 |
| C | 0 | 1898 | 0 |
| D | 0 | 1898 | 0 |
| Mode M9 | |||
|---|---|---|---|
| Quadrant | BADHDUFLAG | Total packets | Discarded packets |
| A | 0 | 130 | 0 |
| B | 0 | 130 | 0 |
| C | 0 | 130 | 0 |
| D | 0 | 130 | 0 |
| Mode M0 | |||
|---|---|---|---|
| Quadrant | BADHDUFLAG | Total packets | Discarded packets |
| A | 0 | 200793 | 0 |
| B | 0 | 195665 | 0 |
| C | 0 | 195957 | 0 |
| D | 0 | 258874 | 0 |
| Quadrant | Total seconds | Saturated seconds | Saturation percentage |
|---|---|---|---|
| A | 93056 | 1109 | 1.191756% |
| B | 93056 | 1365 | 1.466859% |
| C | 93056 | 1780 | 1.912827% |
| D | 93056 | 5694 | 6.118896% |
Noise dominated data is calculated using 1-second bins in cleaned event files. If a bin has >2000 counts, and if more than 50% of those come from <1% of pixels, then it is considered to be noise-dominated and hence unusable.
| Quadrant | # 1 sec bins | Bins with >0 counts | Bins with >2000 counts | High rate bins dominated by noise | Noise dominated (total time) | Noise dominated (detector-on time) | Marked lightcurve |
|---|---|---|---|---|---|---|---|
| A | 106181 | 93049 | 15 | 15 | 0.01% | 0.02% |  |
| B | 106181 | 93051 | 0 | 0 | 0.00% | 0.00% |  |
| C | 106181 | 93050 | 18 | 18 | 0.02% | 0.02% | 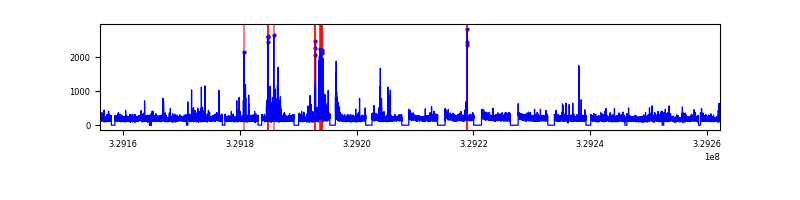 |
| D | 106181 | 93049 | 269 | 269 | 0.25% | 0.29% | 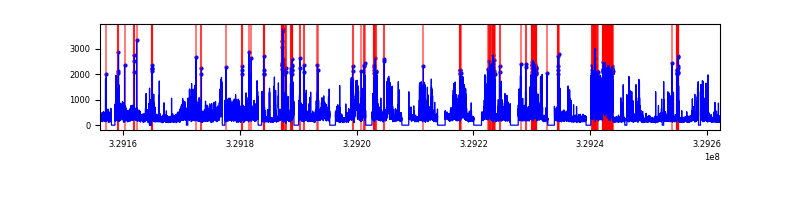 |
Top three noisy pixels from each quadrant. If the there are fewer than three noisy pixels in the level2.evt file, extra rows are filled as -1
| Pixel properties | Quadrant properties | ||||||
|---|---|---|---|---|---|---|---|
| Quadrant | DetID | PixID | Counts | Sigma | Mean | Median | Sigma |
| A | 6 | 16 | 1827057 | 1633.04 | 5184 | 5102 | 1115.7 |
| A | 15 | 173 | 294607 | 259.49 | 5184 | 5102 | 1115.7 |
| A | 3 | 1 | 294368 | 259.27 | 5184 | 5102 | 1115.7 |
| B | 0 | 190 | 205877 | 207.52 | 5171 | 5050 | 967.8 |
| B | 0 | 229 | 171082 | 171.56 | 5171 | 5050 | 967.8 |
| B | 3 | 112 | 153336 | 153.23 | 5171 | 5050 | 967.8 |
| C | 7 | 87 | 663229 | 574.92 | 4895 | 4888 | 1145.1 |
| C | 3 | 233 | 128277 | 107.75 | 4895 | 4888 | 1145.1 |
| C | 9 | 54 | 124290 | 104.27 | 4895 | 4888 | 1145.1 |
| D | 7 | 238 | 8906658 | 7804.61 | 4947 | 4785 | 1140.6 |
| D | 8 | 195 | 6143036 | 5381.64 | 4947 | 4785 | 1140.6 |
| D | 1 | 52 | 1398726 | 1222.12 | 4947 | 4785 | 1140.6 |
Histogram calculated using DETX and DETY for each event in the final _common_clean file
| Quadrant A |  |
 |
Quadrant B |
|---|---|---|---|
| Quadrant D | 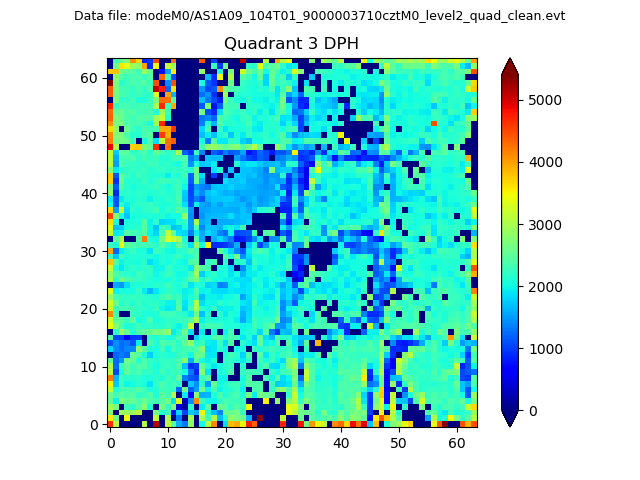 |
 |
Quadrant C |
| Plot type | Count rate plots | Images |
|---|---|---|
| Comparison with Poisson distribution Blue bars denote a histogram of data divided into 1 sec bins. Red curve is a Poisson curve with rate = median count rate of data. |
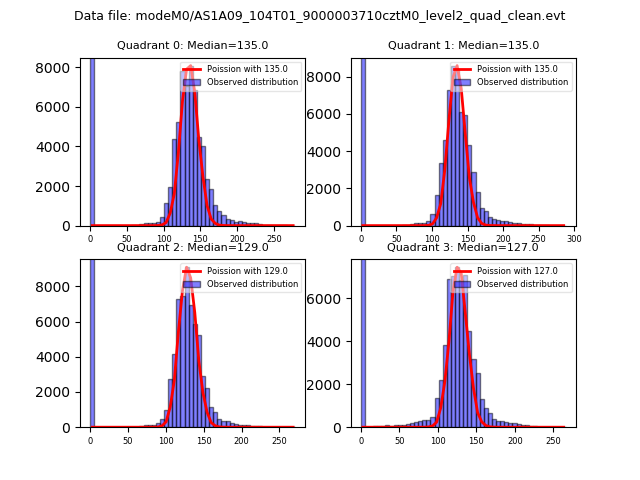 |
 |
| Quadrant-wise count rates Data is divided into 100 sec bins |
 |
|
| Module-wise count rates for Quadrant A Data is divided into 100 sec bins |
 |
 |
| Module-wise count rates for Quadrant B Data is divided into 100 sec bins |
 |
 |
| Module-wise count rates for Quadrant C Data is divided into 100 sec bins |
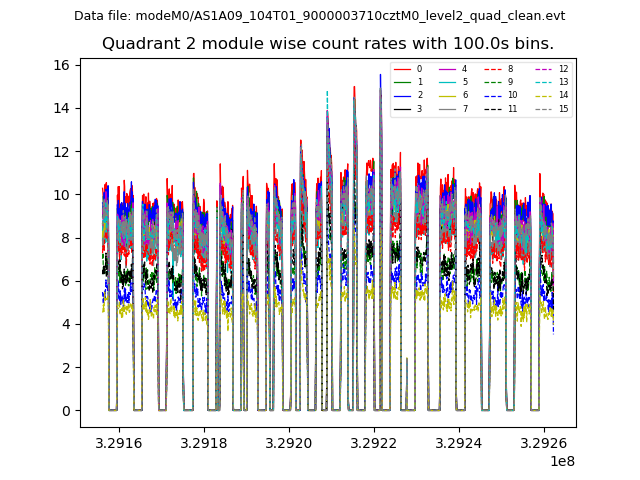 |
 |
| Module-wise count rates for Quadrant D Data is divided into 100 sec bins |
 |
 |
| Parameter | Plot |
|---|---|
| CZT HV Monitor | 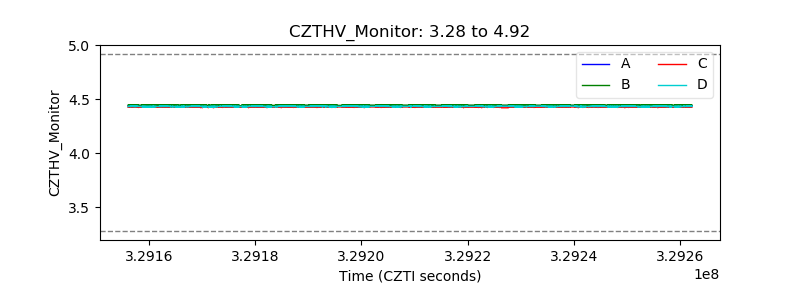 |
| D_VDD |  |
| Temperature 1 |  |
| Veto HV Monitor |  |
| Veto LLD |  |
| Alpha Counter |  |
| _CPM_Rate |  |
| CZT Counter |  |
| +2.5 Volts monitor |  |
| +5 Volts monitor |  |
| _ROLL_ROT |  |
| _Roll_DEC |  |
| _Roll_RA |  |
| Veto Counter |  |