| Param | Original file | Final file |
|---|---|---|
| Filename | modeM0/AS1A09_061T02_9000003708cztM0_level2_bc.evt | modeM0/AS1A09_061T02_9000003708cztM0_level2_quad_clean.evt |
| Size (bytes) | 1,079,000,640 | 487,664,640 |
| Size | 1.0 GB | 465.1 MB |
| Events in quadrant A | 8,474,030 | 3,404,295 |
| Events in quadrant B | 6,015,079 | 3,428,935 |
| Events in quadrant C | 5,691,746 | 3,235,787 |
| Events in quadrant D | 10,984,407 | 3,177,089 |
| Mode SS | |||
|---|---|---|---|
| Quadrant | BADHDUFLAG | Total packets | Discarded packets |
| A | 0 | 450 | 0 |
| B | 0 | 450 | 0 |
| C | 0 | 450 | 0 |
| D | 0 | 450 | 0 |
| Mode M0 | |||
|---|---|---|---|
| Quadrant | BADHDUFLAG | Total packets | Discarded packets |
| A | 0 | 59477 | 0 |
| B | 0 | 49903 | 0 |
| C | 0 | 50204 | 0 |
| D | 0 | 65365 | 0 |
| Mode M9 | |||
|---|---|---|---|
| Quadrant | BADHDUFLAG | Total packets | Discarded packets |
| A | 0 | 54 | 0 |
| B | 0 | 54 | 0 |
| C | 0 | 54 | 0 |
| D | 0 | 54 | 0 |
| Quadrant | Total seconds | Saturated seconds | Saturation percentage |
|---|---|---|---|
| A | 22185 | 455 | 2.050935% |
| B | 22185 | 439 | 1.978815% |
| C | 22185 | 632 | 2.848772% |
| D | 22185 | 822 | 3.705206% |
Noise dominated data is calculated using 1-second bins in cleaned event files. If a bin has >2000 counts, and if more than 50% of those come from <1% of pixels, then it is considered to be noise-dominated and hence unusable.
| Quadrant | # 1 sec bins | Bins with >0 counts | Bins with >2000 counts | High rate bins dominated by noise | Noise dominated (total time) | Noise dominated (detector-on time) | Marked lightcurve |
|---|---|---|---|---|---|---|---|
| A | 27149 | 22182 | 6 | 6 | 0.02% | 0.03% |  |
| B | 27149 | 22181 | 0 | 0 | 0.00% | 0.00% |  |
| C | 27149 | 22181 | 3 | 3 | 0.01% | 0.01% |  |
| D | 27149 | 22182 | 291 | 291 | 1.07% | 1.31% |  |
Top three noisy pixels from each quadrant. If the there are fewer than three noisy pixels in the level2.evt file, extra rows are filled as -1
| Pixel properties | Quadrant properties | ||||||
|---|---|---|---|---|---|---|---|
| Quadrant | DetID | PixID | Counts | Sigma | Mean | Median | Sigma |
| A | 6 | 16 | 2881073 | 9550.86 | 1420 | 1406 | 301.5 |
| A | 15 | 173 | 70938 | 230.61 | 1420 | 1406 | 301.5 |
| A | 3 | 1 | 54378 | 175.69 | 1420 | 1406 | 301.5 |
| B | 3 | 112 | 171412 | 654.44 | 1415 | 1396 | 259.8 |
| B | 0 | 229 | 160251 | 611.48 | 1415 | 1396 | 259.8 |
| B | 7 | 219 | 86548 | 327.77 | 1415 | 1396 | 259.8 |
| C | 7 | 87 | 405533 | 1300.56 | 1330 | 1336 | 310.8 |
| C | 3 | 233 | 152671 | 486.94 | 1330 | 1336 | 310.8 |
| C | 9 | 54 | 15626 | 45.98 | 1330 | 1336 | 310.8 |
| D | 1 | 52 | 3448157 | 10995.7 | 1374 | 1340 | 313.5 |
| D | 8 | 195 | 1812715 | 5778.47 | 1374 | 1340 | 313.5 |
| D | 9 | 35 | 162707 | 514.78 | 1374 | 1340 | 313.5 |
Histogram calculated using DETX and DETY for each event in the final _common_clean file
| Quadrant A |  |
 |
Quadrant B |
|---|---|---|---|
| Quadrant D | 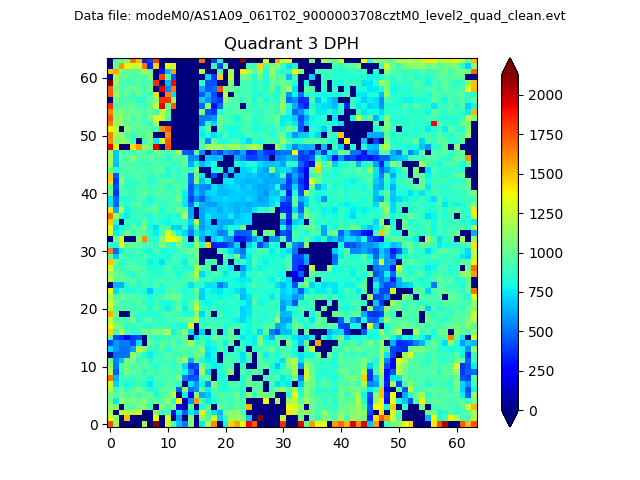 |
 |
Quadrant C |
| Plot type | Count rate plots | Images |
|---|---|---|
| Comparison with Poisson distribution Blue bars denote a histogram of data divided into 1 sec bins. Red curve is a Poisson curve with rate = median count rate of data. |
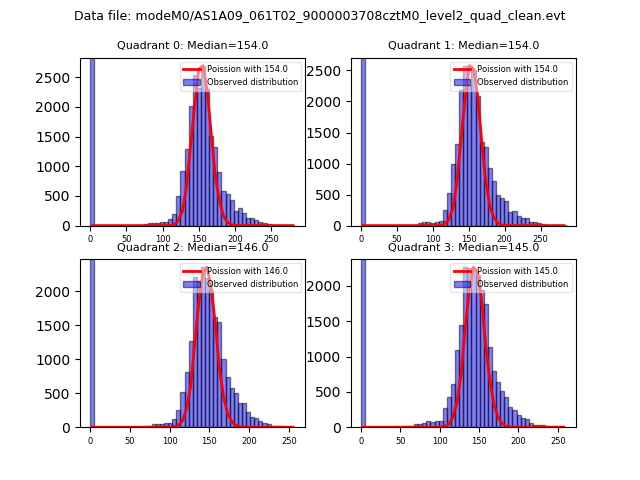 |
 |
| Quadrant-wise count rates Data is divided into 100 sec bins |
 |
|
| Module-wise count rates for Quadrant A Data is divided into 100 sec bins |
 |
 |
| Module-wise count rates for Quadrant B Data is divided into 100 sec bins |
 |
 |
| Module-wise count rates for Quadrant C Data is divided into 100 sec bins |
 |
 |
| Module-wise count rates for Quadrant D Data is divided into 100 sec bins |
 |
 |
| Parameter | Plot |
|---|---|
| CZT HV Monitor |  |
| D_VDD |  |
| Temperature 1 |  |
| Veto HV Monitor |  |
| Veto LLD |  |
| Alpha Counter |  |
| _CPM_Rate |  |
| CZT Counter |  |
| +2.5 Volts monitor |  |
| +5 Volts monitor |  |
| _ROLL_ROT | 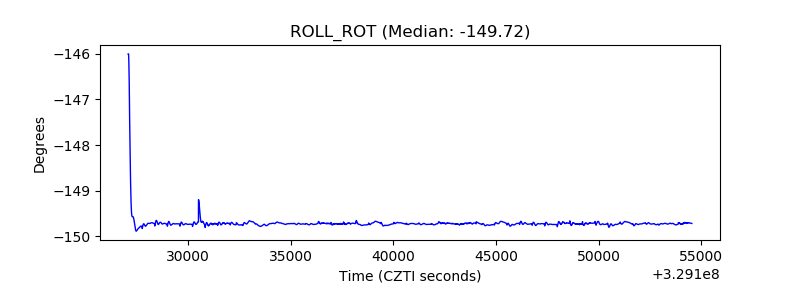 |
| _Roll_DEC |  |
| _Roll_RA |  |
| Veto Counter | 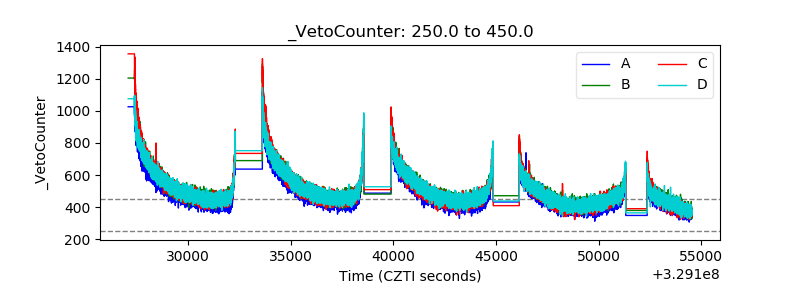 |