| Param | Original file | Final file |
|---|---|---|
| Filename | modeM0/AS1A07_059T07_9000003704cztM0_level2_bc.evt | modeM0/AS1A07_059T07_9000003704cztM0_level2_quad_clean.evt |
| Size (bytes) | 875,856,960 | 216,947,520 |
| Size | 835.3 MB | 206.9 MB |
| Events in quadrant A | 4,488,154 | 1,400,862 |
| Events in quadrant B | 5,765,613 | 1,389,167 |
| Events in quadrant C | 4,291,518 | 1,319,053 |
| Events in quadrant D | 10,811,063 | 1,281,391 |
| Mode SS | |||
|---|---|---|---|
| Quadrant | BADHDUFLAG | Total packets | Discarded packets |
| A | 0 | 350 | 0 |
| B | 0 | 350 | 0 |
| C | 0 | 350 | 0 |
| D | 0 | 350 | 0 |
| Mode M9 | |||
|---|---|---|---|
| Quadrant | BADHDUFLAG | Total packets | Discarded packets |
| A | 0 | 52 | 0 |
| B | 0 | 52 | 0 |
| C | 0 | 52 | 0 |
| D | 0 | 52 | 0 |
| Mode M0 | |||
|---|---|---|---|
| Quadrant | BADHDUFLAG | Total packets | Discarded packets |
| A | 0 | 38701 | 0 |
| B | 0 | 43604 | 0 |
| C | 0 | 38822 | 0 |
| D | 0 | 59568 | 0 |
| Quadrant | Total seconds | Saturated seconds | Saturation percentage |
|---|---|---|---|
| A | 17113 | 310 | 1.811488% |
| B | 17113 | 489 | 2.857477% |
| C | 17113 | 383 | 2.238065% |
| D | 17113 | 1516 | 8.858762% |
Noise dominated data is calculated using 1-second bins in cleaned event files. If a bin has >2000 counts, and if more than 50% of those come from <1% of pixels, then it is considered to be noise-dominated and hence unusable.
| Quadrant | # 1 sec bins | Bins with >0 counts | Bins with >2000 counts | High rate bins dominated by noise | Noise dominated (total time) | Noise dominated (detector-on time) | Marked lightcurve |
|---|---|---|---|---|---|---|---|
| A | 22293 | 17112 | 0 | 0 | 0.00% | 0.00% | 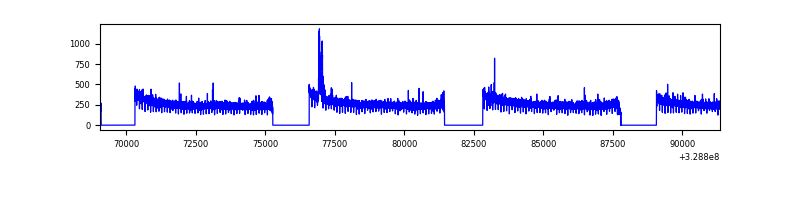 |
| B | 22293 | 17111 | 25 | 25 | 0.11% | 0.15% |  |
| C | 22293 | 17113 | 0 | 0 | 0.00% | 0.00% |  |
| D | 22293 | 17111 | 580 | 580 | 2.60% | 3.39% |  |
Top three noisy pixels from each quadrant. If the there are fewer than three noisy pixels in the level2.evt file, extra rows are filled as -1
| Pixel properties | Quadrant properties | ||||||
|---|---|---|---|---|---|---|---|
| Quadrant | DetID | PixID | Counts | Sigma | Mean | Median | Sigma |
| A | 6 | 16 | 59878 | 246.82 | 1147 | 1136 | 238.0 |
| A | 13 | 254 | 25212 | 101.16 | 1147 | 1136 | 238.0 |
| A | 0 | 226 | 7383 | 26.25 | 1147 | 1136 | 238.0 |
| B | 3 | 112 | 1138223 | 5451.01 | 1136 | 1116 | 208.6 |
| B | 3 | 64 | 249847 | 1192.36 | 1136 | 1116 | 208.6 |
| B | 15 | 32 | 15949 | 71.11 | 1136 | 1116 | 208.6 |
| C | 9 | 54 | 133802 | 542.15 | 1075 | 1078 | 244.8 |
| C | 3 | 233 | 16745 | 64.0 | 1075 | 1078 | 244.8 |
| C | 7 | 247 | 9726 | 35.33 | 1075 | 1078 | 244.8 |
| D | 1 | 52 | 4711286 | 19537.57 | 1096 | 1066 | 241.1 |
| D | 8 | 195 | 1290612 | 5348.92 | 1096 | 1066 | 241.1 |
| D | 7 | 238 | 282854 | 1168.83 | 1096 | 1066 | 241.1 |
Histogram calculated using DETX and DETY for each event in the final _common_clean file
| Quadrant A |  |
 |
Quadrant B |
|---|---|---|---|
| Quadrant D |  |
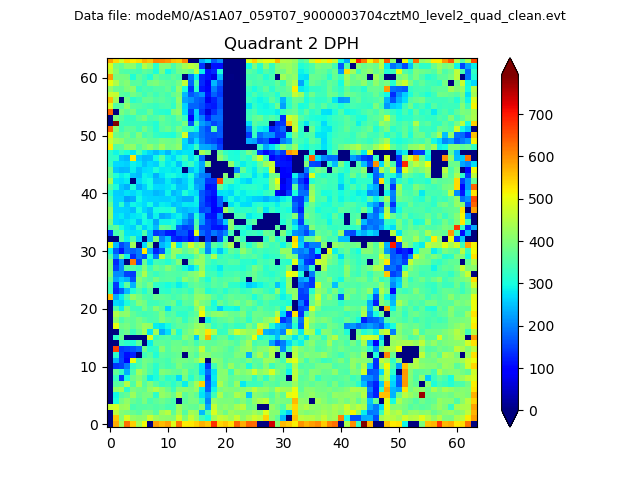 |
Quadrant C |
| Plot type | Count rate plots | Images |
|---|---|---|
| Comparison with Poisson distribution Blue bars denote a histogram of data divided into 1 sec bins. Red curve is a Poisson curve with rate = median count rate of data. |
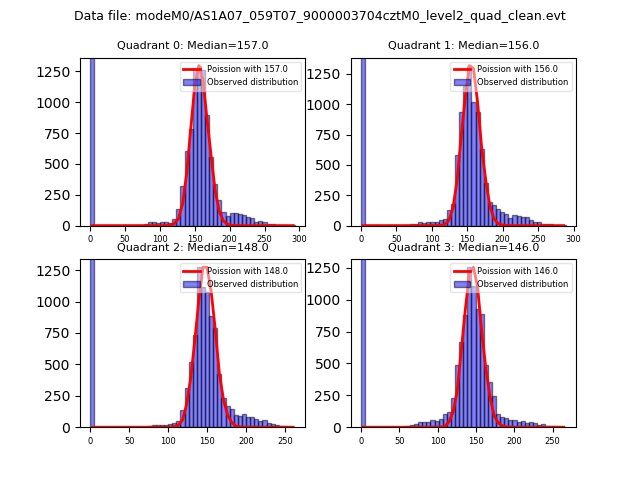 |
 |
| Quadrant-wise count rates Data is divided into 100 sec bins |
 |
|
| Module-wise count rates for Quadrant A Data is divided into 100 sec bins |
 |
 |
| Module-wise count rates for Quadrant B Data is divided into 100 sec bins |
 |
 |
| Module-wise count rates for Quadrant C Data is divided into 100 sec bins |
 |
 |
| Module-wise count rates for Quadrant D Data is divided into 100 sec bins |
 |
 |
| Parameter | Plot |
|---|---|
| CZT HV Monitor |  |
| D_VDD |  |
| Temperature 1 |  |
| Veto HV Monitor |  |
| Veto LLD |  |
| Alpha Counter |  |
| _CPM_Rate |  |
| CZT Counter | 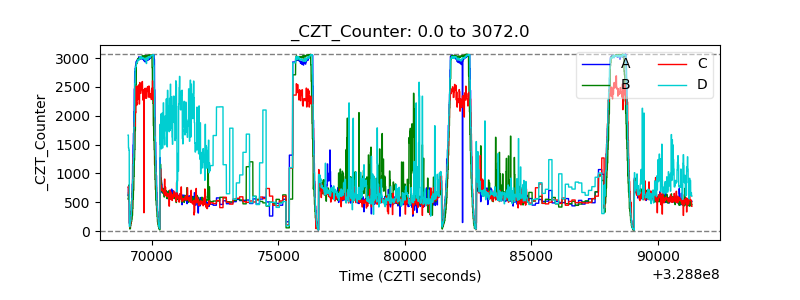 |
| +2.5 Volts monitor |  |
| +5 Volts monitor |  |
| _ROLL_ROT |  |
| _Roll_DEC | 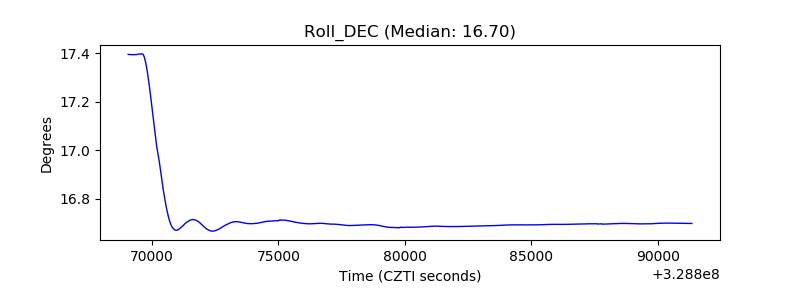 |
| _Roll_RA |  |
| Veto Counter |  |