| Param | Original file | Final file |
|---|---|---|
| Filename | modeM0/AS1A09_022T01_9000003702cztM0_level2_bc.evt | modeM0/AS1A09_022T01_9000003702cztM0_level2_quad_clean.evt |
| Size (bytes) | 6,440,878,080 | 2,136,905,280 |
| Size | 6.0 GB | 2.0 GB |
| Events in quadrant A | 48,758,427 | 14,202,720 |
| Events in quadrant B | 37,674,318 | 14,411,051 |
| Events in quadrant C | 29,960,352 | 13,943,311 |
| Events in quadrant D | 69,173,299 | 12,601,203 |
| Mode SS | |||
|---|---|---|---|
| Quadrant | BADHDUFLAG | Total packets | Discarded packets |
| A | 0 | 2842 | 0 |
| B | 0 | 2842 | 0 |
| C | 0 | 2842 | 0 |
| D | 0 | 2842 | 0 |
| Mode M9 | |||
|---|---|---|---|
| Quadrant | BADHDUFLAG | Total packets | Discarded packets |
| A | 0 | 208 | 0 |
| B | 0 | 208 | 0 |
| C | 0 | 208 | 0 |
| D | 0 | 208 | 0 |
| Mode M0 | |||
|---|---|---|---|
| Quadrant | BADHDUFLAG | Total packets | Discarded packets |
| A | 0 | 348735 | 0 |
| B | 0 | 317737 | 0 |
| C | 0 | 294668 | 0 |
| D | 0 | 456981 | 0 |
| Quadrant | Total seconds | Saturated seconds | Saturation percentage |
|---|---|---|---|
| A | 139593 | 6207 | 4.446498% |
| B | 139595 | 3463 | 2.480748% |
| C | 139595 | 2249 | 1.611089% |
| D | 139592 | 17330 | 12.414752% |
Noise dominated data is calculated using 1-second bins in cleaned event files. If a bin has >2000 counts, and if more than 50% of those come from <1% of pixels, then it is considered to be noise-dominated and hence unusable.
| Quadrant | # 1 sec bins | Bins with >0 counts | Bins with >2000 counts | High rate bins dominated by noise | Noise dominated (total time) | Noise dominated (detector-on time) | Marked lightcurve |
|---|---|---|---|---|---|---|---|
| A | 167172 | 139596 | 2814 | 2814 | 1.68% | 2.02% |  |
| B | 167172 | 139587 | 513 | 513 | 0.31% | 0.37% |  |
| C | 167173 | 139596 | 31 | 31 | 0.02% | 0.02% |  |
| D | 167172 | 139568 | 1999 | 1999 | 1.20% | 1.43% | 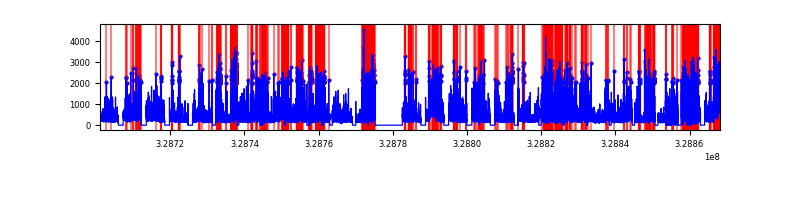 |
Top three noisy pixels from each quadrant. If the there are fewer than three noisy pixels in the level2.evt file, extra rows are filled as -1
| Pixel properties | Quadrant properties | ||||||
|---|---|---|---|---|---|---|---|
| Quadrant | DetID | PixID | Counts | Sigma | Mean | Median | Sigma |
| A | 6 | 16 | 16208482 | 9952.98 | 7630 | 7521 | 1627.7 |
| A | 15 | 173 | 2737116 | 1676.91 | 7630 | 7521 | 1627.7 |
| A | 13 | 254 | 218947 | 129.89 | 7630 | 7521 | 1627.7 |
| B | 3 | 112 | 3764929 | 2641.32 | 7673 | 7522 | 1422.5 |
| B | 3 | 64 | 3508456 | 2461.03 | 7673 | 7522 | 1422.5 |
| B | 0 | 190 | 547896 | 379.86 | 7673 | 7522 | 1422.5 |
| C | 0 | 239 | 633217 | 358.19 | 7412 | 7398 | 1747.2 |
| C | 3 | 233 | 368598 | 206.73 | 7412 | 7398 | 1747.2 |
| C | 2 | 16 | 199921 | 110.19 | 7412 | 7398 | 1747.2 |
| D | 1 | 52 | 16682327 | 9980.71 | 7157 | 6927 | 1670.8 |
| D | 12 | 235 | 9702657 | 5803.17 | 7157 | 6927 | 1670.8 |
| D | 8 | 195 | 6300524 | 3766.9 | 7157 | 6927 | 1670.8 |
Histogram calculated using DETX and DETY for each event in the final _common_clean file
| Quadrant A |  |
 |
Quadrant B |
|---|---|---|---|
| Quadrant D |  |
 |
Quadrant C |
| Plot type | Count rate plots | Images |
|---|---|---|
| Comparison with Poisson distribution Blue bars denote a histogram of data divided into 1 sec bins. Red curve is a Poisson curve with rate = median count rate of data. |
 |
 |
| Quadrant-wise count rates Data is divided into 100 sec bins |
 |
|
| Module-wise count rates for Quadrant A Data is divided into 100 sec bins |
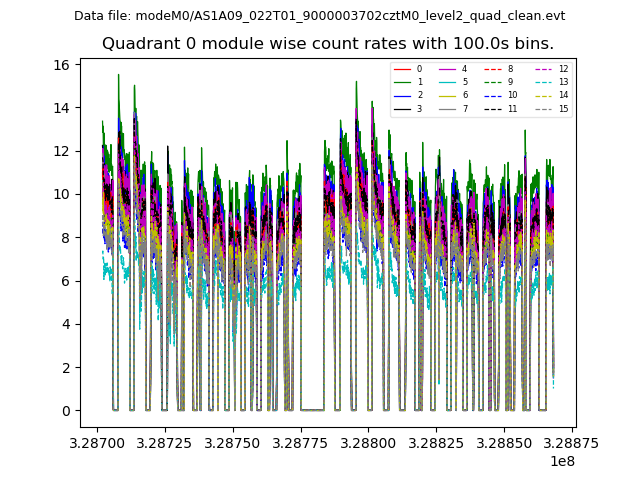 |
 |
| Module-wise count rates for Quadrant B Data is divided into 100 sec bins |
 |
 |
| Module-wise count rates for Quadrant C Data is divided into 100 sec bins |
 |
 |
| Module-wise count rates for Quadrant D Data is divided into 100 sec bins |
 |
 |
| Parameter | Plot |
|---|---|
| CZT HV Monitor |  |
| D_VDD | 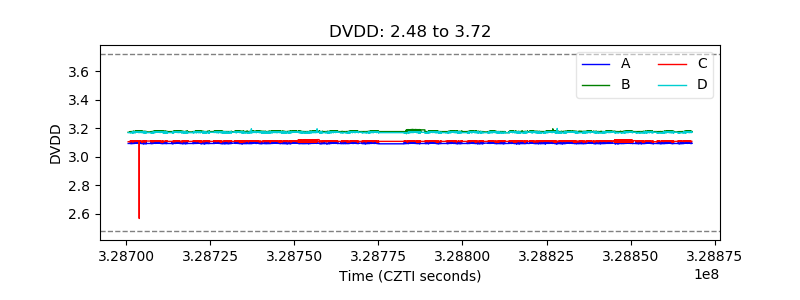 |
| Temperature 1 | 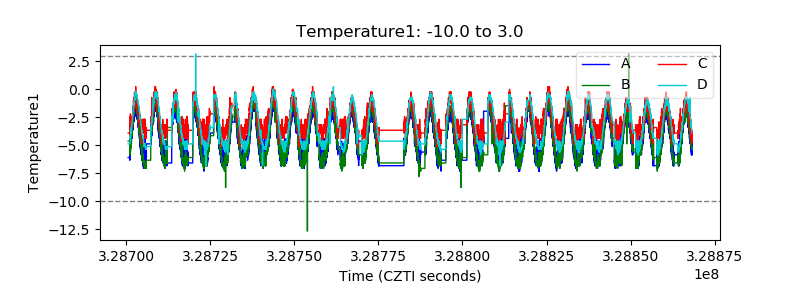 |
| Veto HV Monitor |  |
| Veto LLD |  |
| Alpha Counter |  |
| _CPM_Rate |  |
| CZT Counter |  |
| +2.5 Volts monitor | 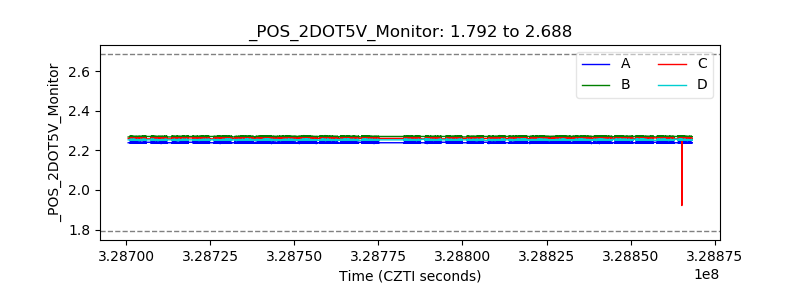 |
| +5 Volts monitor |  |
| _ROLL_ROT |  |
| _Roll_DEC | 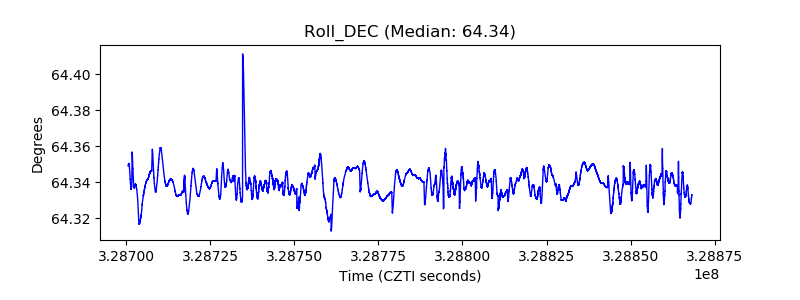 |
| _Roll_RA |  |
| Veto Counter |  |