| Param | Original file | Final file |
|---|---|---|
| Filename | modeM0/AS1C05_002T10_9000003698cztM0_level2_bc.evt | modeM0/AS1C05_002T10_9000003698cztM0_level2_quad_clean.evt |
| Size (bytes) | 239,342,400 | 70,058,880 |
| Size | 228.3 MB | 66.8 MB |
| Events in quadrant A | 1,116,890 | 445,047 |
| Events in quadrant B | 1,422,158 | 447,523 |
| Events in quadrant C | 1,270,968 | 428,379 |
| Events in quadrant D | 3,053,914 | 412,752 |
| Mode M0 | |||
|---|---|---|---|
| Quadrant | BADHDUFLAG | Total packets | Discarded packets |
| A | 0 | 11434 | 0 |
| B | 0 | 12618 | 0 |
| C | 0 | 12210 | 0 |
| D | 0 | 17426 | 0 |
| Mode SS | |||
|---|---|---|---|
| Quadrant | BADHDUFLAG | Total packets | Discarded packets |
| A | 0 | 112 | 0 |
| B | 0 | 112 | 0 |
| C | 0 | 112 | 0 |
| D | 0 | 112 | 0 |
| Mode M9 | |||
|---|---|---|---|
| Quadrant | BADHDUFLAG | Total packets | Discarded packets |
| A | 0 | 3 | 0 |
| B | 0 | 3 | 0 |
| C | 0 | 3 | 0 |
| D | 0 | 3 | 0 |
| Quadrant | Total seconds | Saturated seconds | Saturation percentage |
|---|---|---|---|
| A | 5544 | 23 | 0.414863% |
| B | 5544 | 109 | 1.966089% |
| C | 5544 | 88 | 1.587302% |
| D | 5544 | 114 | 2.056277% |
Noise dominated data is calculated using 1-second bins in cleaned event files. If a bin has >2000 counts, and if more than 50% of those come from <1% of pixels, then it is considered to be noise-dominated and hence unusable.
| Quadrant | # 1 sec bins | Bins with >0 counts | Bins with >2000 counts | High rate bins dominated by noise | Noise dominated (total time) | Noise dominated (detector-on time) | Marked lightcurve |
|---|---|---|---|---|---|---|---|
| A | 5844 | 5544 | 0 | 0 | 0.00% | 0.00% |  |
| B | 5844 | 5544 | 4 | 4 | 0.07% | 0.07% |  |
| C | 5844 | 5544 | 0 | 0 | 0.00% | 0.00% |  |
| D | 5844 | 5544 | 14 | 14 | 0.24% | 0.25% |  |
Top three noisy pixels from each quadrant. If the there are fewer than three noisy pixels in the level2.evt file, extra rows are filled as -1
| Pixel properties | Quadrant properties | ||||||
|---|---|---|---|---|---|---|---|
| Quadrant | DetID | PixID | Counts | Sigma | Mean | Median | Sigma |
| A | 6 | 16 | 8567 | 125.7 | 287 | 279 | 65.9 |
| A | 13 | 254 | 7823 | 114.42 | 287 | 279 | 65.9 |
| A | 0 | 226 | 1854 | 23.89 | 287 | 279 | 65.9 |
| B | 3 | 64 | 261366 | 4524.87 | 286 | 279 | 57.7 |
| B | 3 | 112 | 52935 | 912.57 | 286 | 279 | 57.7 |
| B | 0 | 219 | 7210 | 120.12 | 286 | 279 | 57.7 |
| C | 0 | 239 | 122628 | 1829.14 | 276 | 273 | 66.9 |
| C | 3 | 233 | 33721 | 500.03 | 276 | 273 | 66.9 |
| C | 2 | 16 | 31292 | 463.72 | 276 | 273 | 66.9 |
| D | 8 | 195 | 1710313 | 25042.86 | 282 | 271 | 68.3 |
| D | 1 | 52 | 185272 | 2709.26 | 282 | 271 | 68.3 |
| D | 12 | 235 | 48754 | 710.01 | 282 | 271 | 68.3 |
Histogram calculated using DETX and DETY for each event in the final _common_clean file
| Quadrant A |  |
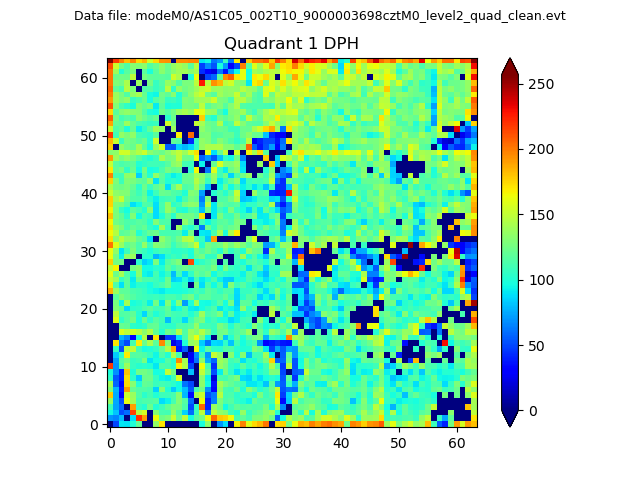 |
Quadrant B |
|---|---|---|---|
| Quadrant D |  |
 |
Quadrant C |
| Plot type | Count rate plots | Images |
|---|---|---|
| Comparison with Poisson distribution Blue bars denote a histogram of data divided into 1 sec bins. Red curve is a Poisson curve with rate = median count rate of data. |
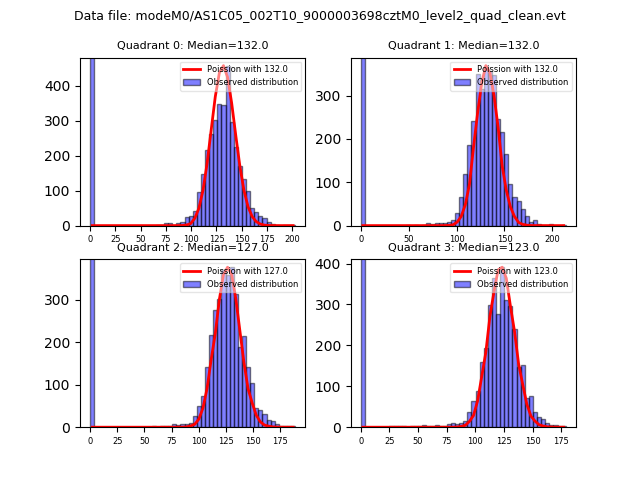 |
 |
| Quadrant-wise count rates Data is divided into 100 sec bins |
 |
|
| Module-wise count rates for Quadrant A Data is divided into 100 sec bins |
 |
 |
| Module-wise count rates for Quadrant B Data is divided into 100 sec bins |
 |
 |
| Module-wise count rates for Quadrant C Data is divided into 100 sec bins |
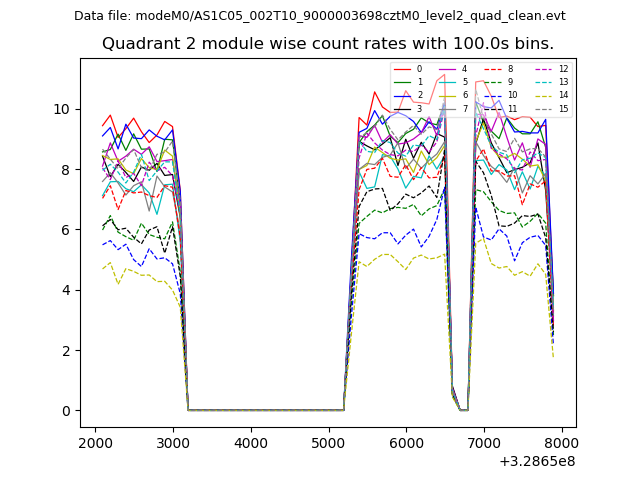 |
 |
| Module-wise count rates for Quadrant D Data is divided into 100 sec bins |
 |
 |
| Parameter | Plot |
|---|---|
| CZT HV Monitor | 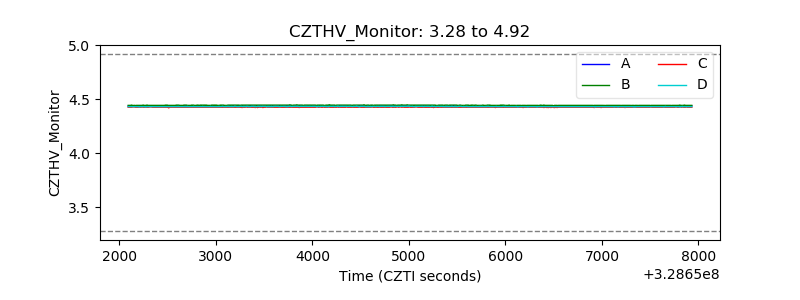 |
| D_VDD |  |
| Temperature 1 |  |
| Veto HV Monitor |  |
| Veto LLD |  |
| Alpha Counter |  |
| _CPM_Rate |  |
| CZT Counter |  |
| +2.5 Volts monitor | 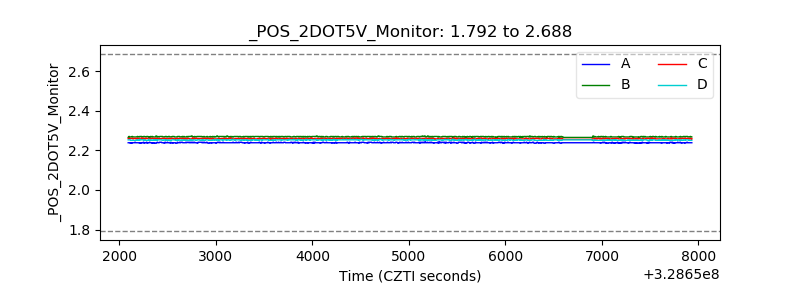 |
| +5 Volts monitor |  |
| _ROLL_ROT | 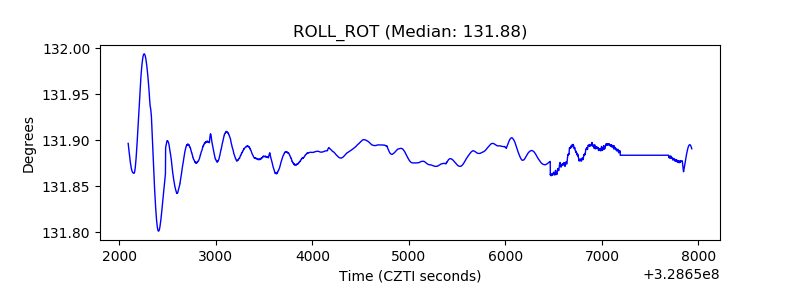 |
| _Roll_DEC | 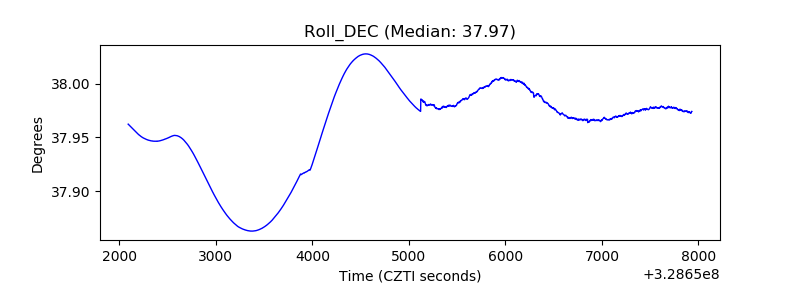 |
| _Roll_RA |  |
| Veto Counter | 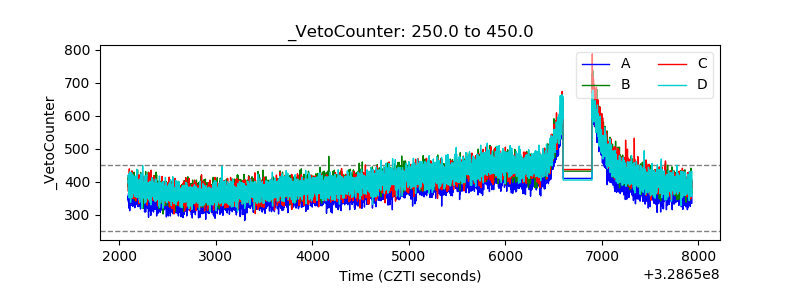 |