| Param | Original file | Final file |
|---|---|---|
| Filename | modeM0/AS1A09_006T01_9000003700cztM0_level2_bc.evt | modeM0/AS1A09_006T01_9000003700cztM0_level2_quad_clean.evt |
| Size (bytes) | 1,641,496,320 | 450,737,280 |
| Size | 1.5 GB | 429.9 MB |
| Events in quadrant A | 7,551,216 | 2,910,709 |
| Events in quadrant B | 10,143,782 | 2,866,563 |
| Events in quadrant C | 8,584,557 | 2,759,270 |
| Events in quadrant D | 20,943,400 | 2,604,927 |
| Mode M9 | |||
|---|---|---|---|
| Quadrant | BADHDUFLAG | Total packets | Discarded packets |
| A | 0 | 45 | 0 |
| B | 0 | 45 | 0 |
| C | 0 | 45 | 0 |
| D | 0 | 45 | 0 |
| Mode SS | |||
|---|---|---|---|
| Quadrant | BADHDUFLAG | Total packets | Discarded packets |
| A | 0 | 738 | 0 |
| B | 0 | 738 | 0 |
| C | 0 | 738 | 0 |
| D | 0 | 738 | 0 |
| Mode M0 | |||
|---|---|---|---|
| Quadrant | BADHDUFLAG | Total packets | Discarded packets |
| A | 0 | 74823 | 0 |
| B | 0 | 85689 | 0 |
| C | 0 | 79381 | 0 |
| D | 0 | 117570 | 0 |
| Quadrant | Total seconds | Saturated seconds | Saturation percentage |
|---|---|---|---|
| A | 36556 | 171 | 0.467775% |
| B | 36556 | 1326 | 3.627312% |
| C | 36556 | 634 | 1.734325% |
| D | 36556 | 2346 | 6.417551% |
Noise dominated data is calculated using 1-second bins in cleaned event files. If a bin has >2000 counts, and if more than 50% of those come from <1% of pixels, then it is considered to be noise-dominated and hence unusable.
| Quadrant | # 1 sec bins | Bins with >0 counts | Bins with >2000 counts | High rate bins dominated by noise | Noise dominated (total time) | Noise dominated (detector-on time) | Marked lightcurve |
|---|---|---|---|---|---|---|---|
| A | 40816 | 36556 | 1 | 1 | 0.00% | 0.00% |  |
| B | 40816 | 36556 | 48 | 48 | 0.12% | 0.13% |  |
| C | 40816 | 36555 | 49 | 49 | 0.12% | 0.13% |  |
| D | 40816 | 36554 | 775 | 775 | 1.90% | 2.12% | 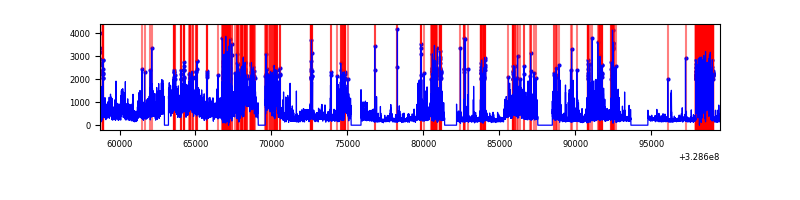 |
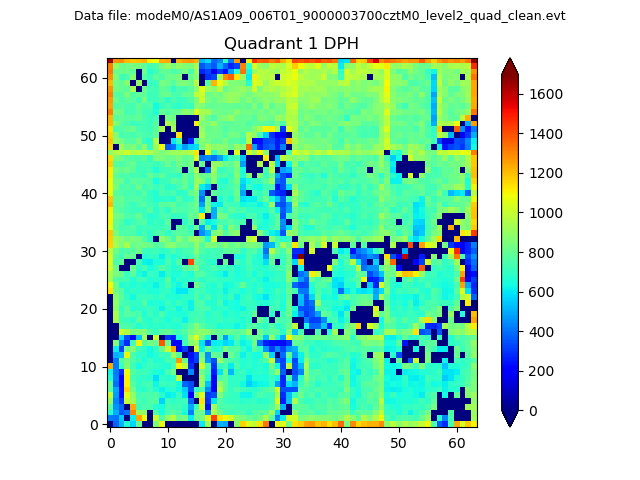
Top three noisy pixels from each quadrant. If the there are fewer than three noisy pixels in the level2.evt file, extra rows are filled as -1
| Pixel properties | Quadrant properties | ||||||
|---|---|---|---|---|---|---|---|
| Quadrant | DetID | PixID | Counts | Sigma | Mean | Median | Sigma |
| A | 13 | 254 | 53587 | 121.71 | 1946 | 1910 | 424.6 |
| A | 13 | 170 | 21339 | 45.76 | 1946 | 1910 | 424.6 |
| A | 0 | 226 | 12343 | 24.57 | 1946 | 1910 | 424.6 |
| B | 3 | 64 | 2600254 | 7013.05 | 1921 | 1871 | 370.5 |
| B | 3 | 112 | 84681 | 223.5 | 1921 | 1871 | 370.5 |
| B | 0 | 190 | 39556 | 101.71 | 1921 | 1871 | 370.5 |
| C | 0 | 239 | 873294 | 2021.72 | 1832 | 1821 | 431.1 |
| C | 0 | 207 | 488527 | 1129.11 | 1832 | 1821 | 431.1 |
| C | 7 | 247 | 70325 | 158.92 | 1832 | 1821 | 431.1 |
| D | 8 | 195 | 7032074 | 16373.51 | 1846 | 1778 | 429.4 |
| D | 1 | 52 | 6432107 | 14976.19 | 1846 | 1778 | 429.4 |
| D | 2 | 234 | 156741 | 360.91 | 1846 | 1778 | 429.4 |
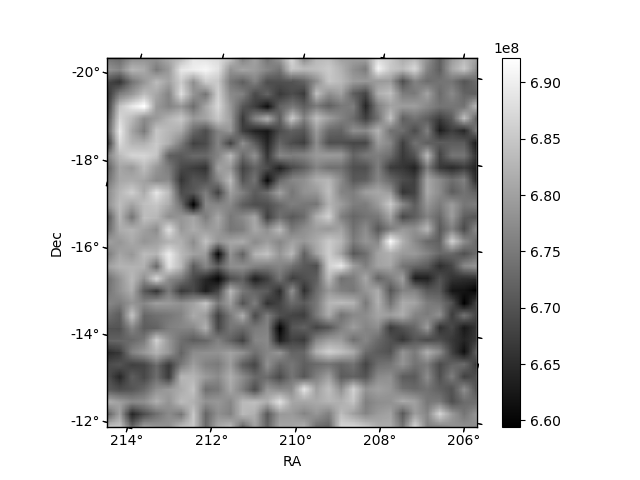
Histogram calculated using DETX and DETY for each event in the final _common_clean file
| Quadrant A | 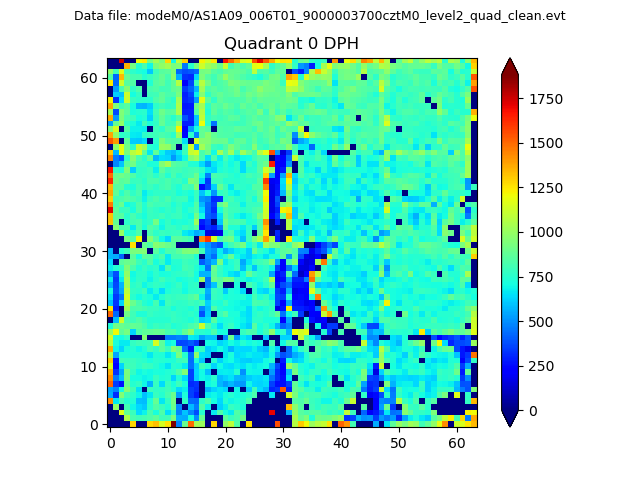 |
 |
Quadrant B |
|---|---|---|---|
| Quadrant D |  |
 |
Quadrant C |
| Plot type | Count rate plots | Images |
|---|---|---|
| Comparison with Poisson distribution Blue bars denote a histogram of data divided into 1 sec bins. Red curve is a Poisson curve with rate = median count rate of data. |
 |
 |
| Quadrant-wise count rates Data is divided into 100 sec bins |
 |
|
| Module-wise count rates for Quadrant A Data is divided into 100 sec bins |
 |
 |
| Module-wise count rates for Quadrant B Data is divided into 100 sec bins |
 |
 |
| Module-wise count rates for Quadrant C Data is divided into 100 sec bins |
 |
 |
| Module-wise count rates for Quadrant D Data is divided into 100 sec bins |
 |
 |
| Parameter | Plot |
|---|---|
| CZT HV Monitor |  |
| D_VDD |  |
| Temperature 1 |  |
| Veto HV Monitor |  |
| Veto LLD |  |
| Alpha Counter |  |
| _CPM_Rate |  |
| CZT Counter |  |
| +2.5 Volts monitor | 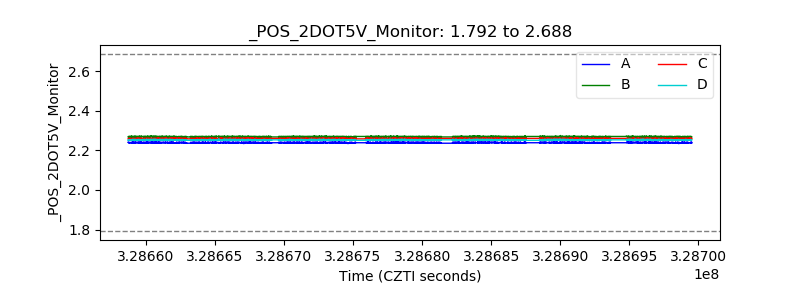 |
| +5 Volts monitor |  |
| _ROLL_ROT |  |
| _Roll_DEC |  |
| _Roll_RA | 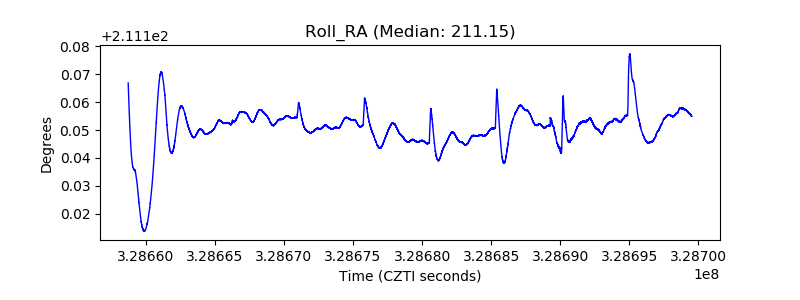 |
| Veto Counter |  |