| Param | Original file | Final file |
|---|---|---|
| Filename | modeM0/AS1A09_027T02_9000003696cztM0_level2_bc.evt | modeM0/AS1A09_027T02_9000003696cztM0_level2_quad_clean.evt |
| Size (bytes) | 4,137,837,120 | 1,184,169,600 |
| Size | 3.9 GB | 1.1 GB |
| Events in quadrant A | 15,948,448 | 8,101,129 |
| Events in quadrant B | 27,332,451 | 7,773,932 |
| Events in quadrant C | 17,394,284 | 7,728,526 |
| Events in quadrant D | 59,593,337 | 7,168,637 |
| Mode M0 | |||
|---|---|---|---|
| Quadrant | BADHDUFLAG | Total packets | Discarded packets |
| A | 0 | 153990 | 0 |
| B | 0 | 205428 | 0 |
| C | 0 | 161087 | 0 |
| D | 0 | 301949 | 0 |
| Mode M9 | |||
|---|---|---|---|
| Quadrant | BADHDUFLAG | Total packets | Discarded packets |
| A | 0 | 122 | 0 |
| B | 0 | 122 | 0 |
| C | 0 | 122 | 0 |
| D | 0 | 122 | 0 |
| Mode SS | |||
|---|---|---|---|
| Quadrant | BADHDUFLAG | Total packets | Discarded packets |
| A | 0 | 1512 | 0 |
| B | 0 | 1512 | 0 |
| C | 0 | 1512 | 0 |
| D | 0 | 1512 | 0 |
| Quadrant | Total seconds | Saturated seconds | Saturation percentage |
|---|---|---|---|
| A | 74294 | 564 | 0.759146% |
| B | 74294 | 7009 | 9.434140% |
| C | 74294 | 1289 | 1.734999% |
| D | 74294 | 8723 | 11.741190% |
Noise dominated data is calculated using 1-second bins in cleaned event files. If a bin has >2000 counts, and if more than 50% of those come from <1% of pixels, then it is considered to be noise-dominated and hence unusable.
| Quadrant | # 1 sec bins | Bins with >0 counts | Bins with >2000 counts | High rate bins dominated by noise | Noise dominated (total time) | Noise dominated (detector-on time) | Marked lightcurve |
|---|---|---|---|---|---|---|---|
| A | 86359 | 74296 | 0 | 0 | 0.00% | 0.00% |  |
| B | 86359 | 74271 | 381 | 381 | 0.44% | 0.51% | 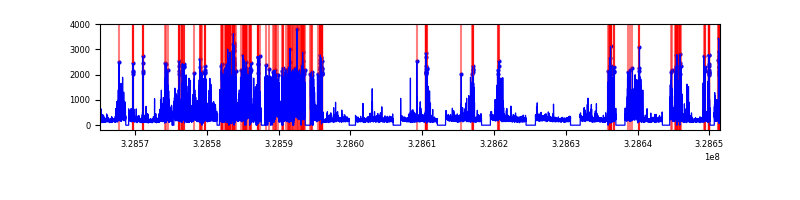 |
| C | 86359 | 74291 | 15 | 15 | 0.02% | 0.02% | 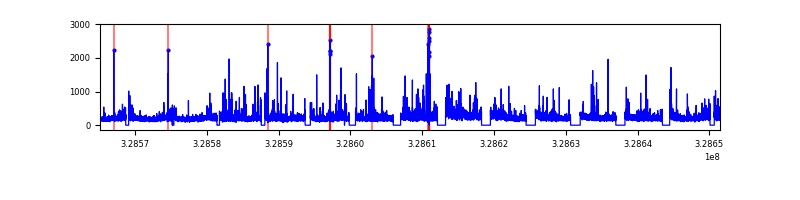 |
| D | 86359 | 74285 | 1292 | 1292 | 1.50% | 1.74% |  |
Top three noisy pixels from each quadrant. If the there are fewer than three noisy pixels in the level2.evt file, extra rows are filled as -1
| Pixel properties | Quadrant properties | ||||||
|---|---|---|---|---|---|---|---|
| Quadrant | DetID | PixID | Counts | Sigma | Mean | Median | Sigma |
| A | 3 | 1 | 195202 | 216.5 | 4074 | 4011 | 883.1 |
| A | 13 | 254 | 115897 | 126.69 | 4074 | 4011 | 883.1 |
| A | 0 | 226 | 26822 | 25.83 | 4074 | 4011 | 883.1 |
| B | 3 | 64 | 11251725 | 15510.58 | 3897 | 3814 | 725.2 |
| B | 0 | 190 | 356492 | 486.33 | 3897 | 3814 | 725.2 |
| B | 15 | 33 | 243667 | 330.75 | 3897 | 3814 | 725.2 |
| C | 0 | 207 | 774568 | 839.69 | 3886 | 3884 | 917.8 |
| C | 3 | 233 | 770467 | 835.22 | 3886 | 3884 | 917.8 |
| C | 0 | 239 | 562287 | 608.4 | 3886 | 3884 | 917.8 |
| D | 8 | 195 | 17675242 | 19542.52 | 3848 | 3731 | 904.3 |
| D | 1 | 52 | 12514996 | 13835.92 | 3848 | 3731 | 904.3 |
| D | 9 | 35 | 8614918 | 9522.91 | 3848 | 3731 | 904.3 |
Histogram calculated using DETX and DETY for each event in the final _common_clean file
| Quadrant A |  |
 |
Quadrant B |
|---|---|---|---|
| Quadrant D |  |
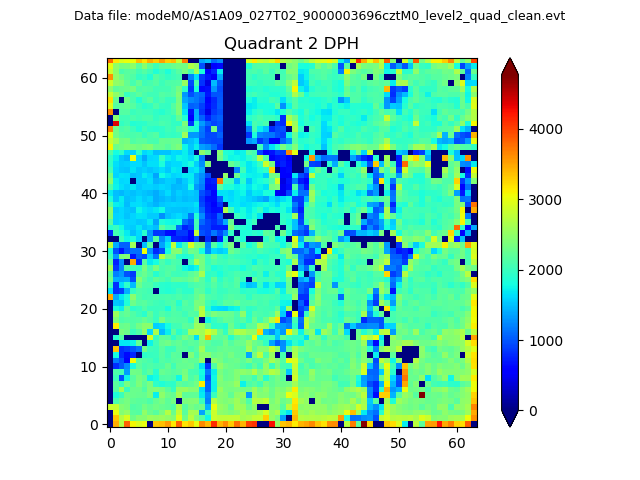 |
Quadrant C |
| Plot type | Count rate plots | Images |
|---|---|---|
| Comparison with Poisson distribution Blue bars denote a histogram of data divided into 1 sec bins. Red curve is a Poisson curve with rate = median count rate of data. |
 |
 |
| Quadrant-wise count rates Data is divided into 100 sec bins |
 |
|
| Module-wise count rates for Quadrant A Data is divided into 100 sec bins |
 |
 |
| Module-wise count rates for Quadrant B Data is divided into 100 sec bins |
 |
 |
| Module-wise count rates for Quadrant C Data is divided into 100 sec bins |
 |
 |
| Module-wise count rates for Quadrant D Data is divided into 100 sec bins |
 |
 |
| Parameter | Plot |
|---|---|
| CZT HV Monitor |  |
| D_VDD |  |
| Temperature 1 |  |
| Veto HV Monitor | 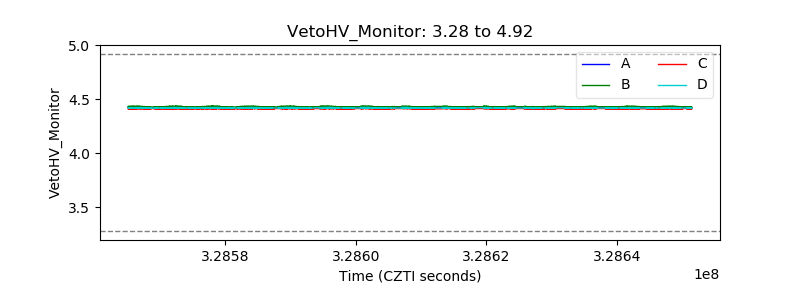 |
| Veto LLD |  |
| Alpha Counter |  |
| _CPM_Rate |  |
| CZT Counter |  |
| +2.5 Volts monitor |  |
| +5 Volts monitor |  |
| _ROLL_ROT |  |
| _Roll_DEC |  |
| _Roll_RA | 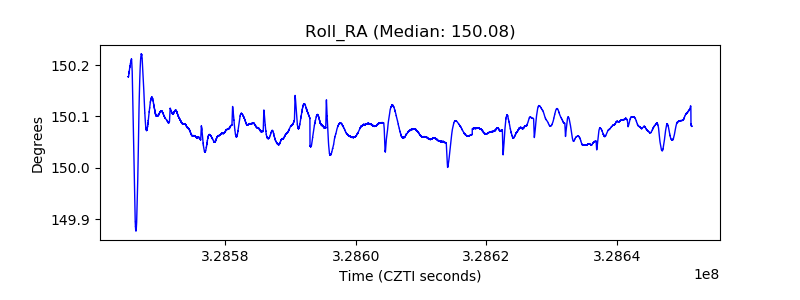 |
| Veto Counter | 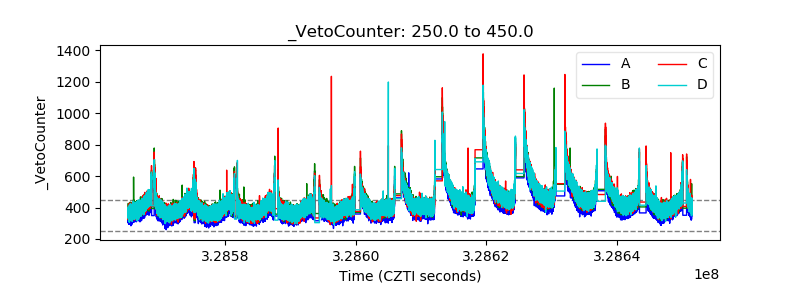 |