| Param | Original file | Final file |
|---|---|---|
| Filename | modeM0/AS1A09_027T01_9000003694cztM0_level2_bc.evt | modeM0/AS1A09_027T01_9000003694cztM0_level2_quad_clean.evt |
| Size (bytes) | 3,943,572,480 | 906,200,640 |
| Size | 3.7 GB | 864.2 MB |
| Events in quadrant A | 13,172,416 | 6,568,980 |
| Events in quadrant B | 14,781,965 | 6,572,076 |
| Events in quadrant C | 20,922,169 | 6,139,160 |
| Events in quadrant D | 66,577,797 | 4,152,187 |
| Mode M0 | |||
|---|---|---|---|
| Quadrant | BADHDUFLAG | Total packets | Discarded packets |
| A | 0 | 122574 | 0 |
| B | 0 | 129669 | 0 |
| C | 0 | 154501 | 0 |
| D | 0 | 364769 | 0 |
| Mode M9 | |||
|---|---|---|---|
| Quadrant | BADHDUFLAG | Total packets | Discarded packets |
| A | 0 | 110 | 0 |
| B | 0 | 110 | 0 |
| C | 0 | 110 | 0 |
| D | 0 | 110 | 0 |
| Mode SS | |||
|---|---|---|---|
| Quadrant | BADHDUFLAG | Total packets | Discarded packets |
| A | 0 | 1190 | 0 |
| B | 0 | 1190 | 0 |
| C | 0 | 1190 | 0 |
| D | 0 | 1190 | 0 |
| Quadrant | Total seconds | Saturated seconds | Saturation percentage |
|---|---|---|---|
| A | 58383 | 504 | 0.863265% |
| B | 58383 | 943 | 1.615196% |
| C | 58383 | 3797 | 6.503606% |
| D | 58383 | 31081 | 53.236387% |
Noise dominated data is calculated using 1-second bins in cleaned event files. If a bin has >2000 counts, and if more than 50% of those come from <1% of pixels, then it is considered to be noise-dominated and hence unusable.
| Quadrant | # 1 sec bins | Bins with >0 counts | Bins with >2000 counts | High rate bins dominated by noise | Noise dominated (total time) | Noise dominated (detector-on time) | Marked lightcurve |
|---|---|---|---|---|---|---|---|
| A | 69408 | 58383 | 1 | 1 | 0.00% | 0.00% | 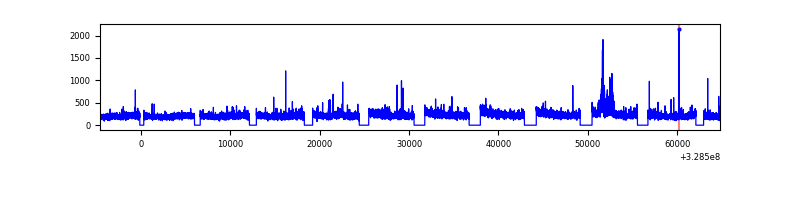 |
| B | 69408 | 58384 | 26 | 26 | 0.04% | 0.04% | 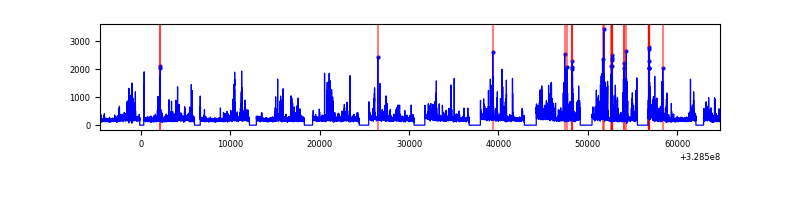 |
| C | 69408 | 58376 | 435 | 435 | 0.63% | 0.75% |  |
| D | 69408 | 58272 | 5424 | 5424 | 7.81% | 9.31% |  |
Top three noisy pixels from each quadrant. If the there are fewer than three noisy pixels in the level2.evt file, extra rows are filled as -1
| Pixel properties | Quadrant properties | ||||||
|---|---|---|---|---|---|---|---|
| Quadrant | DetID | PixID | Counts | Sigma | Mean | Median | Sigma |
| A | 6 | 16 | 411054 | 582.03 | 3246 | 3194 | 700.8 |
| A | 3 | 1 | 148922 | 207.96 | 3246 | 3194 | 700.8 |
| A | 13 | 254 | 92568 | 127.54 | 3246 | 3194 | 700.8 |
| B | 3 | 64 | 849809 | 1396.96 | 3234 | 3167 | 606.1 |
| B | 0 | 229 | 438169 | 717.75 | 3234 | 3167 | 606.1 |
| B | 15 | 33 | 361745 | 591.65 | 3234 | 3167 | 606.1 |
| C | 0 | 239 | 5881747 | 8255.63 | 3019 | 3023 | 712.1 |
| C | 7 | 247 | 1191729 | 1669.33 | 3019 | 3023 | 712.1 |
| C | 2 | 16 | 1157606 | 1621.41 | 3019 | 3023 | 712.1 |
| D | 1 | 239 | 37417757 | 69094.82 | 2255 | 2185 | 541.5 |
| D | 8 | 195 | 8142559 | 15032.72 | 2255 | 2185 | 541.5 |
| D | 9 | 35 | 7945795 | 14669.35 | 2255 | 2185 | 541.5 |
Histogram calculated using DETX and DETY for each event in the final _common_clean file
| Quadrant A |  |
 |
Quadrant B |
|---|---|---|---|
| Quadrant D |  |
 |
Quadrant C |
| Plot type | Count rate plots | Images |
|---|---|---|
| Comparison with Poisson distribution Blue bars denote a histogram of data divided into 1 sec bins. Red curve is a Poisson curve with rate = median count rate of data. |
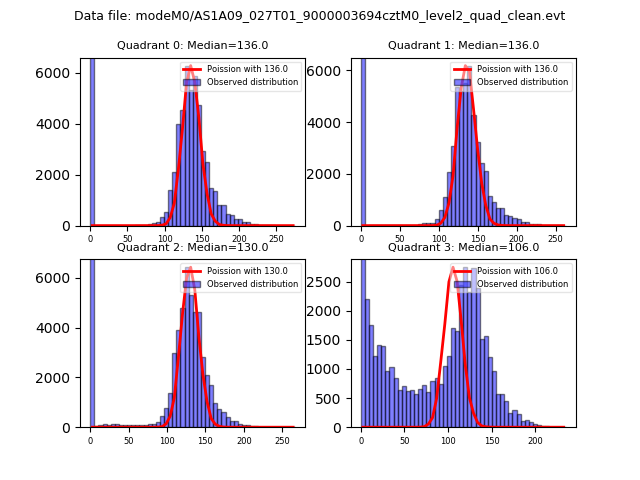 |
 |
| Quadrant-wise count rates Data is divided into 100 sec bins |
 |
|
| Module-wise count rates for Quadrant A Data is divided into 100 sec bins |
 |
 |
| Module-wise count rates for Quadrant B Data is divided into 100 sec bins |
 |
 |
| Module-wise count rates for Quadrant C Data is divided into 100 sec bins |
 |
 |
| Module-wise count rates for Quadrant D Data is divided into 100 sec bins |
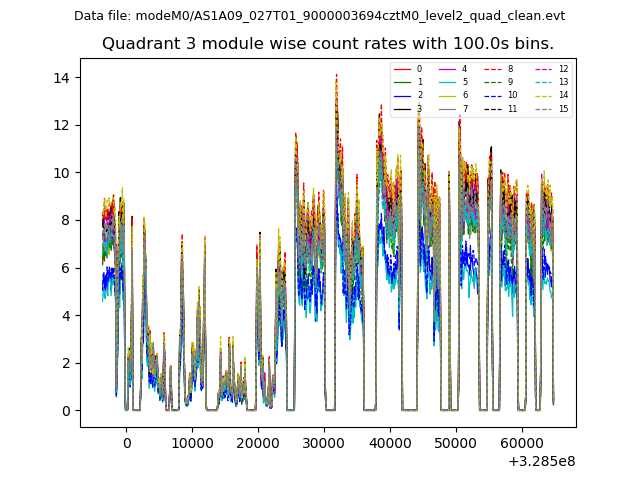 |
 |
| Parameter | Plot |
|---|---|
| CZT HV Monitor |  |
| D_VDD |  |
| Temperature 1 |  |
| Veto HV Monitor |  |
| Veto LLD |  |
| Alpha Counter |  |
| _CPM_Rate |  |
| CZT Counter | 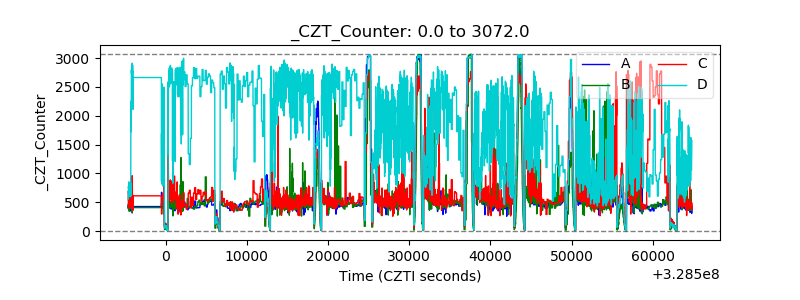 |
| +2.5 Volts monitor |  |
| +5 Volts monitor | 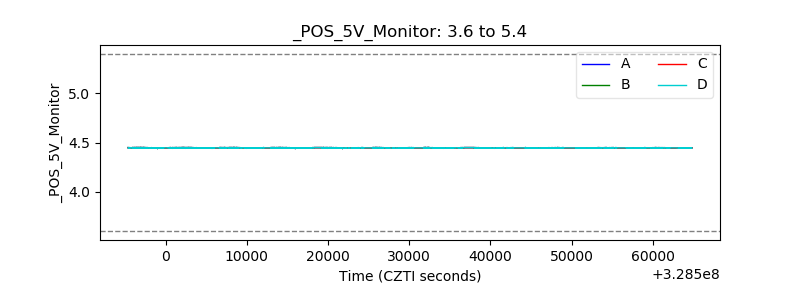 |
| _ROLL_ROT |  |
| _Roll_DEC |  |
| _Roll_RA |  |
| Veto Counter |  |