| Param | Original file | Final file |
|---|---|---|
| Filename | modeM0/AS1C05_002T10_9000003688cztM0_level2_bc.evt | modeM0/AS1C05_002T10_9000003688cztM0_level2_quad_clean.evt |
| Size (bytes) | 184,374,720 | 75,718,080 |
| Size | 175.8 MB | 72.2 MB |
| Events in quadrant A | 1,124,405 | 493,778 |
| Events in quadrant B | 1,271,193 | 495,903 |
| Events in quadrant C | 1,090,070 | 472,218 |
| Events in quadrant D | 1,737,428 | 468,204 |
| Mode M9 | |||
|---|---|---|---|
| Quadrant | BADHDUFLAG | Total packets | Discarded packets |
| A | 0 | 14 | 0 |
| B | 0 | 15 | 0 |
| C | 0 | 15 | 0 |
| D | 0 | 15 | 0 |
| Mode M0 | |||
|---|---|---|---|
| Quadrant | BADHDUFLAG | Total packets | Discarded packets |
| A | 0 | 10883 | 0 |
| B | 0 | 11445 | 0 |
| C | 0 | 10813 | 0 |
| D | 0 | 12441 | 0 |
| Mode SS | |||
|---|---|---|---|
| Quadrant | BADHDUFLAG | Total packets | Discarded packets |
| A | 0 | 104 | 0 |
| B | 0 | 104 | 0 |
| C | 0 | 104 | 0 |
| D | 0 | 104 | 0 |
| Quadrant | Total seconds | Saturated seconds | Saturation percentage |
|---|---|---|---|
| A | 5185 | 65 | 1.253616% |
| B | 5185 | 120 | 2.314368% |
| C | 5185 | 93 | 1.793635% |
| D | 5185 | 57 | 1.099325% |
Noise dominated data is calculated using 1-second bins in cleaned event files. If a bin has >2000 counts, and if more than 50% of those come from <1% of pixels, then it is considered to be noise-dominated and hence unusable.
| Quadrant | # 1 sec bins | Bins with >0 counts | Bins with >2000 counts | High rate bins dominated by noise | Noise dominated (total time) | Noise dominated (detector-on time) | Marked lightcurve |
|---|---|---|---|---|---|---|---|
| A | 5184 | 5184 | 0 | 0 | 0.00% | 0.00% |  |
| B | 5185 | 5185 | 1 | 1 | 0.02% | 0.02% |  |
| C | 5184 | 5184 | 3 | 3 | 0.06% | 0.06% |  |
| D | 5184 | 5184 | 0 | 0 | 0.00% | 0.00% |  |
Top three noisy pixels from each quadrant. If the there are fewer than three noisy pixels in the level2.evt file, extra rows are filled as -1
| Pixel properties | Quadrant properties | ||||||
|---|---|---|---|---|---|---|---|
| Quadrant | DetID | PixID | Counts | Sigma | Mean | Median | Sigma |
| A | 15 | 174 | 12454 | 189.79 | 288 | 282 | 64.1 |
| A | 13 | 254 | 7813 | 117.42 | 288 | 282 | 64.1 |
| A | 12 | 194 | 1773 | 23.25 | 288 | 282 | 64.1 |
| B | 3 | 64 | 129929 | 2311.73 | 287 | 280 | 56.1 |
| B | 0 | 190 | 12807 | 223.37 | 287 | 280 | 56.1 |
| B | 10 | 251 | 10828 | 188.08 | 287 | 280 | 56.1 |
| C | 14 | 225 | 16252 | 241.61 | 274 | 273 | 66.1 |
| C | 7 | 247 | 8440 | 123.49 | 274 | 273 | 66.1 |
| C | 7 | 220 | 4527 | 64.32 | 274 | 273 | 66.1 |
| D | 8 | 195 | 450219 | 6836.23 | 282 | 271 | 65.8 |
| D | 1 | 255 | 73854 | 1117.97 | 282 | 271 | 65.8 |
| D | 1 | 52 | 54447 | 823.12 | 282 | 271 | 65.8 |
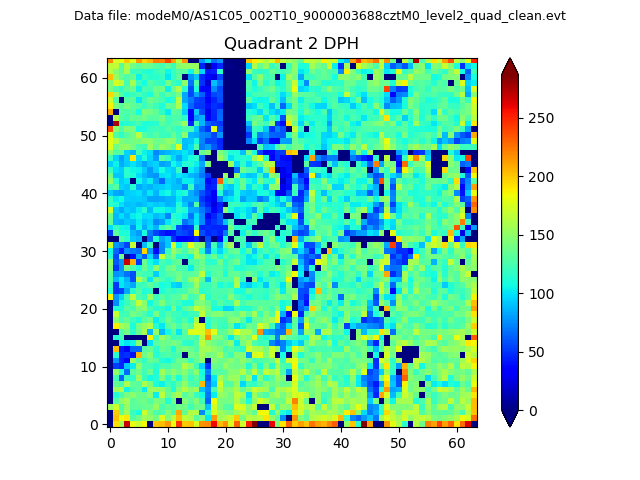
Histogram calculated using DETX and DETY for each event in the final _common_clean file
| Quadrant A |  |
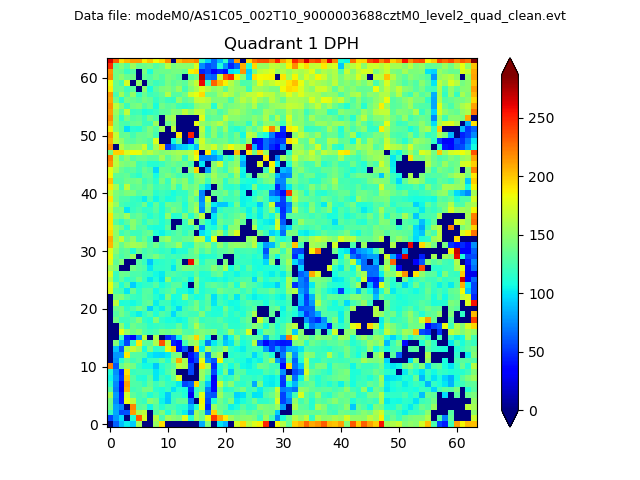 |
Quadrant B |
|---|---|---|---|
| Quadrant D |  |
 |
Quadrant C |
| Plot type | Count rate plots | Images |
|---|---|---|
| Comparison with Poisson distribution Blue bars denote a histogram of data divided into 1 sec bins. Red curve is a Poisson curve with rate = median count rate of data. |
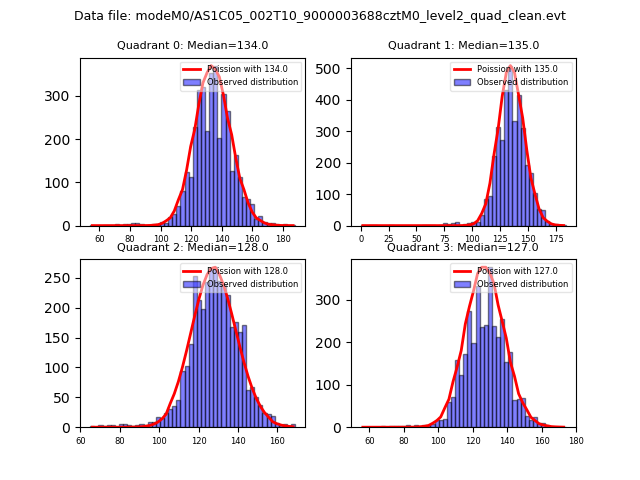 |
 |
| Quadrant-wise count rates Data is divided into 100 sec bins |
 |
|
| Module-wise count rates for Quadrant A Data is divided into 100 sec bins |
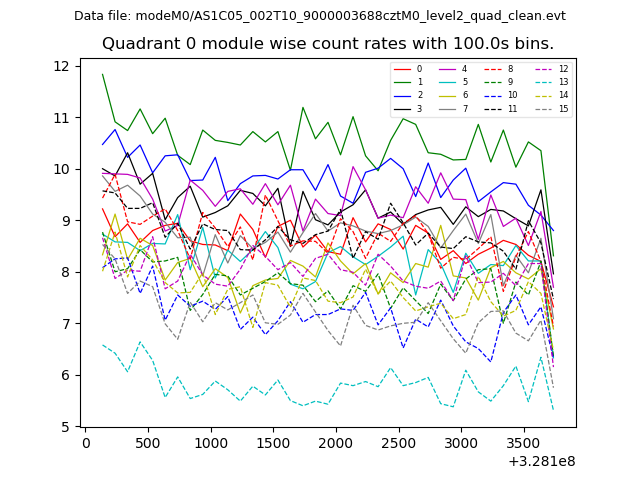 |
 |
| Module-wise count rates for Quadrant B Data is divided into 100 sec bins |
 |
 |
| Module-wise count rates for Quadrant C Data is divided into 100 sec bins |
 |
 |
| Module-wise count rates for Quadrant D Data is divided into 100 sec bins |
 |
 |
| Parameter | Plot |
|---|---|
| CZT HV Monitor | 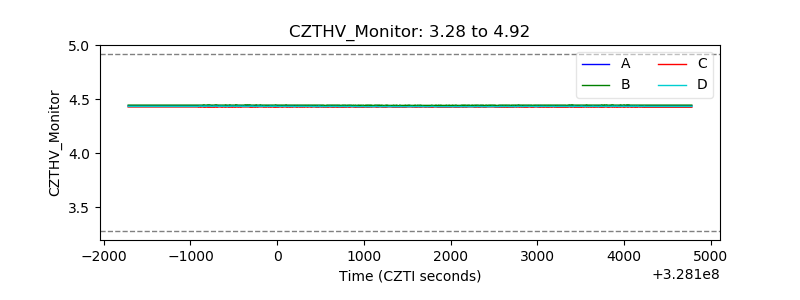 |
| D_VDD |  |
| Temperature 1 | 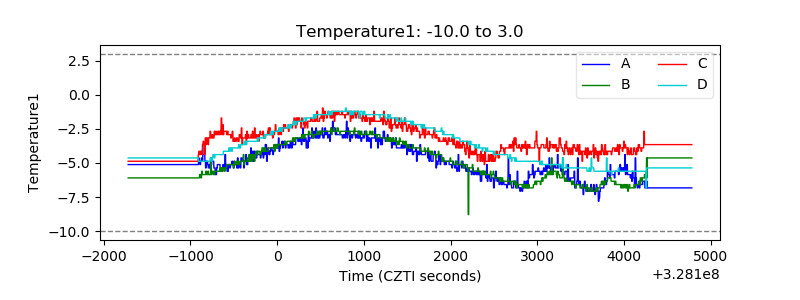 |
| Veto HV Monitor | 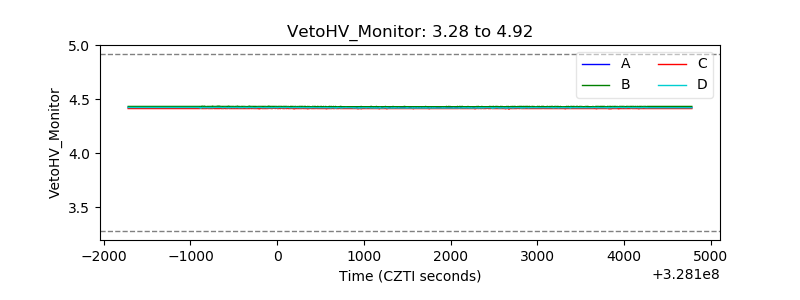 |
| Veto LLD |  |
| Alpha Counter |  |
| _CPM_Rate |  |
| CZT Counter | 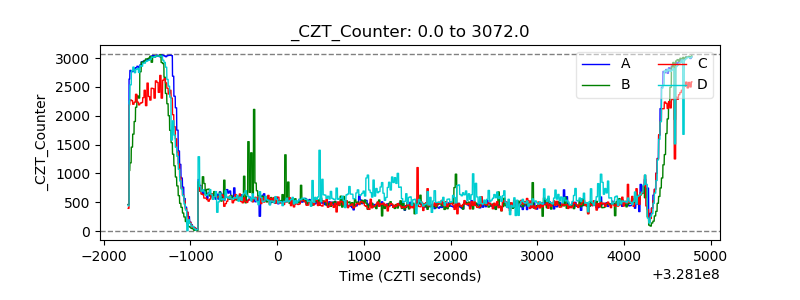 |
| +2.5 Volts monitor |  |
| +5 Volts monitor | 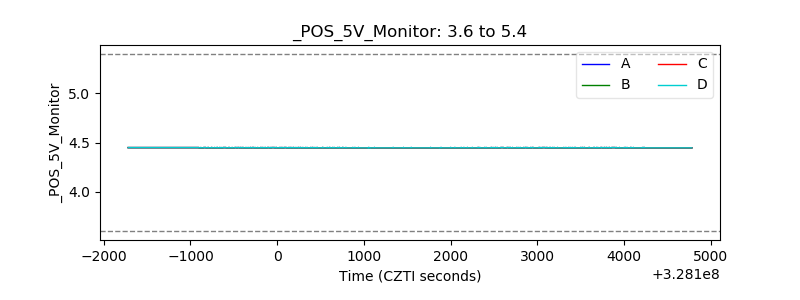 |
| _ROLL_ROT |  |
| _Roll_DEC |  |
| _Roll_RA | 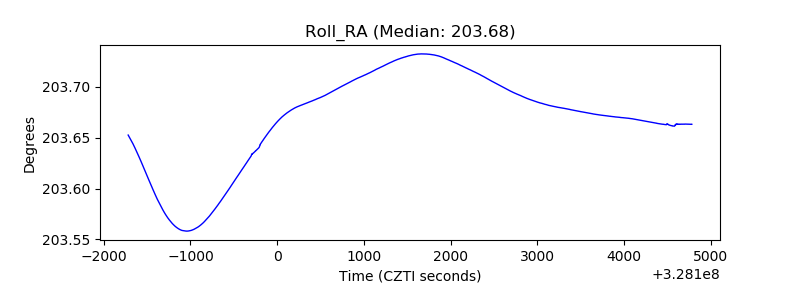 |
| Veto Counter | 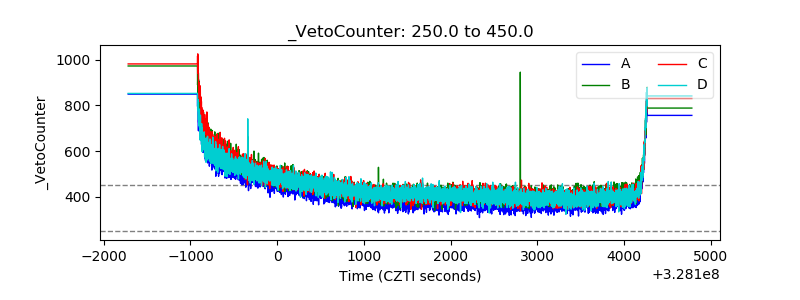 |