| Param | Original file | Final file |
|---|---|---|
| Filename | modeM0/AS1A07_027T01_9000003690cztM0_level2_bc.evt | modeM0/AS1A07_027T01_9000003690cztM0_level2_quad_clean.evt |
| Size (bytes) | 4,332,528,000 | 1,592,352,000 |
| Size | 4.0 GB | 1.5 GB |
| Events in quadrant A | 25,280,290 | 10,332,087 |
| Events in quadrant B | 28,094,892 | 10,405,900 |
| Events in quadrant C | 28,438,860 | 9,872,320 |
| Events in quadrant D | 41,541,201 | 9,713,707 |
| Mode M9 | |||
|---|---|---|---|
| Quadrant | BADHDUFLAG | Total packets | Discarded packets |
| A | 0 | 195 | 0 |
| B | 0 | 195 | 0 |
| C | 0 | 195 | 0 |
| D | 0 | 195 | 0 |
| Mode M0 | |||
|---|---|---|---|
| Quadrant | BADHDUFLAG | Total packets | Discarded packets |
| A | 0 | 240212 | 0 |
| B | 0 | 250898 | 0 |
| C | 0 | 254004 | 0 |
| D | 0 | 290221 | 0 |
| Mode SS | |||
|---|---|---|---|
| Quadrant | BADHDUFLAG | Total packets | Discarded packets |
| A | 0 | 2350 | 0 |
| B | 0 | 2350 | 0 |
| C | 0 | 2350 | 0 |
| D | 0 | 2350 | 0 |
| Quadrant | Total seconds | Saturated seconds | Saturation percentage |
|---|---|---|---|
| A | 115428 | 1037 | 0.898396% |
| B | 115428 | 1762 | 1.526493% |
| C | 115428 | 1954 | 1.692830% |
| D | 115428 | 2567 | 2.223897% |
Noise dominated data is calculated using 1-second bins in cleaned event files. If a bin has >2000 counts, and if more than 50% of those come from <1% of pixels, then it is considered to be noise-dominated and hence unusable.
| Quadrant | # 1 sec bins | Bins with >0 counts | Bins with >2000 counts | High rate bins dominated by noise | Noise dominated (total time) | Noise dominated (detector-on time) | Marked lightcurve |
|---|---|---|---|---|---|---|---|
| A | 134828 | 115432 | 0 | 0 | 0.00% | 0.00% |  |
| B | 134828 | 115432 | 30 | 30 | 0.02% | 0.03% |  |
| C | 134828 | 115431 | 38 | 38 | 0.03% | 0.03% |  |
| D | 134827 | 115428 | 458 | 458 | 0.34% | 0.40% |  |
Top three noisy pixels from each quadrant. If the there are fewer than three noisy pixels in the level2.evt file, extra rows are filled as -1
| Pixel properties | Quadrant properties | ||||||
|---|---|---|---|---|---|---|---|
| Quadrant | DetID | PixID | Counts | Sigma | Mean | Median | Sigma |
| A | 13 | 254 | 171039 | 118.05 | 6508 | 6418 | 1394.5 |
| A | 13 | 170 | 136086 | 92.98 | 6508 | 6418 | 1394.5 |
| A | 0 | 226 | 41930 | 25.47 | 6508 | 6418 | 1394.5 |
| B | 5 | 235 | 1366461 | 1131.3 | 6491 | 6352 | 1202.3 |
| B | 3 | 64 | 1097670 | 907.72 | 6491 | 6352 | 1202.3 |
| B | 0 | 190 | 275320 | 223.72 | 6491 | 6352 | 1202.3 |
| C | 7 | 247 | 3943416 | 2736.98 | 6158 | 6156 | 1438.5 |
| C | 0 | 239 | 316708 | 215.88 | 6158 | 6156 | 1438.5 |
| C | 8 | 208 | 263730 | 179.05 | 6158 | 6156 | 1438.5 |
| D | 8 | 195 | 7229399 | 4940.53 | 6326 | 6126 | 1462.0 |
| D | 12 | 235 | 3103992 | 2118.86 | 6326 | 6126 | 1462.0 |
| D | 12 | 233 | 1932422 | 1317.53 | 6326 | 6126 | 1462.0 |
Histogram calculated using DETX and DETY for each event in the final _common_clean file
| Quadrant A | 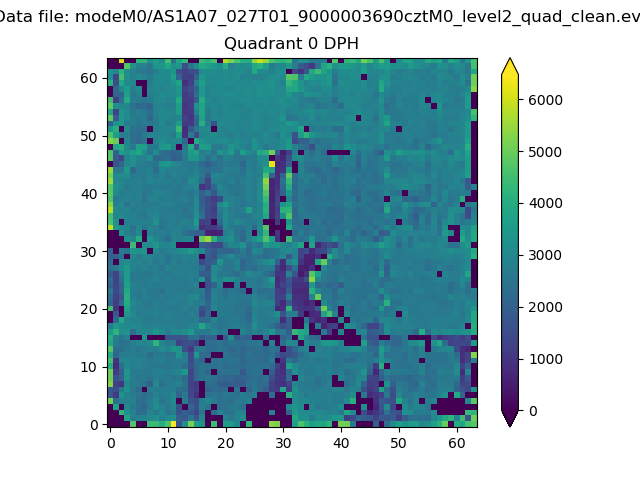 |
 |
Quadrant B |
|---|---|---|---|
| Quadrant D | 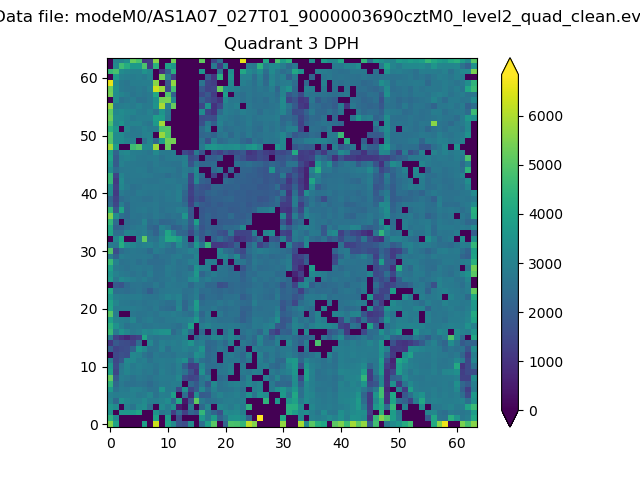 |
 |
Quadrant C |
| Plot type | Count rate plots | Images |
|---|---|---|
| Comparison with Poisson distribution Blue bars denote a histogram of data divided into 1 sec bins. Red curve is a Poisson curve with rate = median count rate of data. |
 |
 |
| Quadrant-wise count rates Data is divided into 100 sec bins |
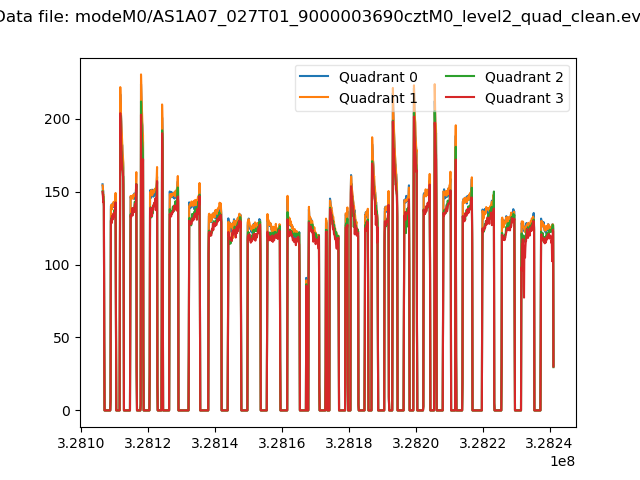 |
|
| Module-wise count rates for Quadrant A Data is divided into 100 sec bins |
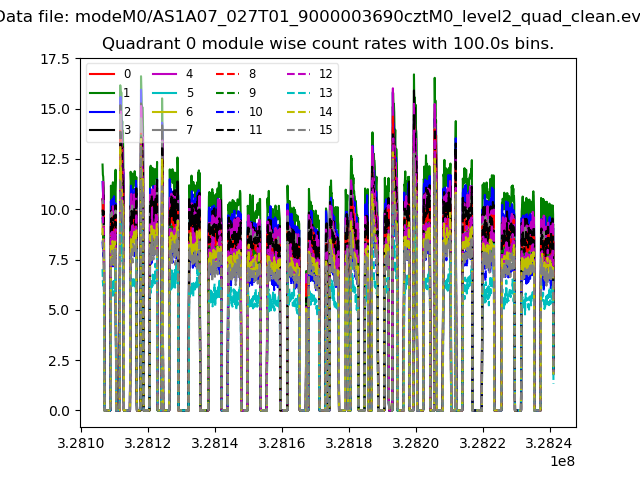 |
 |
| Module-wise count rates for Quadrant B Data is divided into 100 sec bins |
 |
 |
| Module-wise count rates for Quadrant C Data is divided into 100 sec bins |
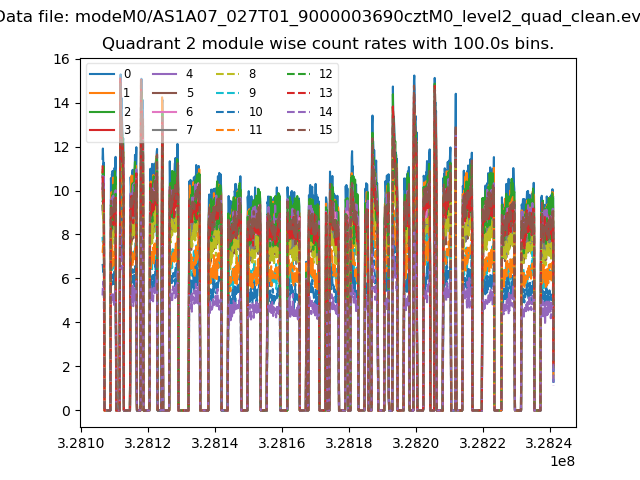 |
 |
| Module-wise count rates for Quadrant D Data is divided into 100 sec bins |
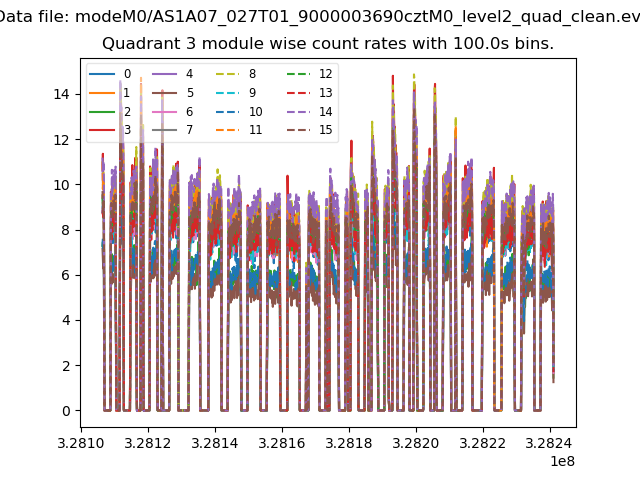 |
 |
| Parameter | Plot |
|---|---|
| CZT HV Monitor |  |
| D_VDD | 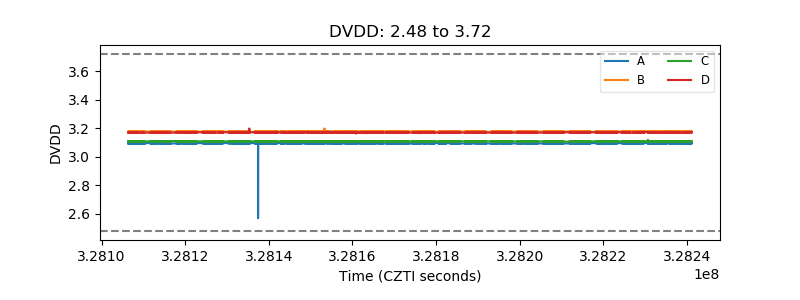 |
| Temperature 1 |  |
| Veto HV Monitor |  |
| Veto LLD |  |
| Alpha Counter |  |
| _CPM_Rate | 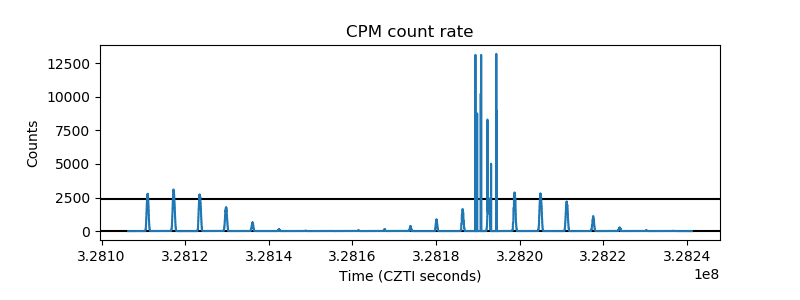 |
| CZT Counter |  |
| +2.5 Volts monitor |  |
| +5 Volts monitor | 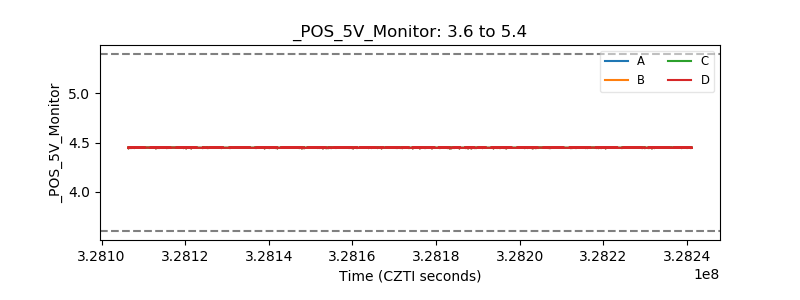 |
| _ROLL_ROT |  |
| _Roll_DEC |  |
| _Roll_RA |  |
| Veto Counter |  |