| Param | Original file | Final file |
|---|---|---|
| Filename | modeM0/AS1A07_171T02_9000003686cztM0_level2_bc.evt | modeM0/AS1A07_171T02_9000003686cztM0_level2_quad_clean.evt |
| Size (bytes) | 1,539,253,440 | 583,784,640 |
| Size | 1.4 GB | 556.7 MB |
| Events in quadrant A | 8,293,863 | 3,800,798 |
| Events in quadrant B | 13,898,809 | 3,766,919 |
| Events in quadrant C | 9,586,354 | 3,672,928 |
| Events in quadrant D | 12,018,463 | 3,605,411 |
| Mode SS | |||
|---|---|---|---|
| Quadrant | BADHDUFLAG | Total packets | Discarded packets |
| A | 0 | 842 | 0 |
| B | 0 | 720 | 0 |
| C | 0 | 844 | 0 |
| D | 0 | 844 | 0 |
| Mode M0 | |||
|---|---|---|---|
| Quadrant | BADHDUFLAG | Total packets | Discarded packets |
| A | 0 | 84381 | 0 |
| B | 0 | 104467 | 0 |
| C | 0 | 88935 | 0 |
| D | 0 | 93918 | 0 |
| Mode M9 | |||
|---|---|---|---|
| Quadrant | BADHDUFLAG | Total packets | Discarded packets |
| A | 0 | 42 | 0 |
| B | 0 | 42 | 0 |
| C | 0 | 42 | 0 |
| D | 0 | 42 | 0 |
| Quadrant | Total seconds | Saturated seconds | Saturation percentage |
|---|---|---|---|
| A | 41400 | 302 | 0.729469% |
| B | 41417 | 2498 | 6.031340% |
| C | 41400 | 807 | 1.949275% |
| D | 41407 | 470 | 1.135074% |
Noise dominated data is calculated using 1-second bins in cleaned event files. If a bin has >2000 counts, and if more than 50% of those come from <1% of pixels, then it is considered to be noise-dominated and hence unusable.
| Quadrant | # 1 sec bins | Bins with >0 counts | Bins with >2000 counts | High rate bins dominated by noise | Noise dominated (total time) | Noise dominated (detector-on time) | Marked lightcurve |
|---|---|---|---|---|---|---|---|
| A | 45724 | 41423 | 0 | 0 | 0.00% | 0.00% |  |
| B | 45724 | 41438 | 350 | 350 | 0.77% | 0.84% |  |
| C | 45724 | 41413 | 47 | 47 | 0.10% | 0.11% |  |
| D | 45724 | 41441 | 23 | 23 | 0.05% | 0.06% |  |
Top three noisy pixels from each quadrant. If the there are fewer than three noisy pixels in the level2.evt file, extra rows are filled as -1
| Pixel properties | Quadrant properties | ||||||
|---|---|---|---|---|---|---|---|
| Quadrant | DetID | PixID | Counts | Sigma | Mean | Median | Sigma |
| A | 13 | 254 | 63633 | 130.44 | 2147 | 2106 | 471.7 |
| A | 0 | 226 | 13627 | 24.42 | 2147 | 2106 | 471.7 |
| A | 12 | 194 | 13191 | 23.5 | 2147 | 2106 | 471.7 |
| B | 3 | 64 | 5348158 | 13137.39 | 2118 | 2068 | 406.9 |
| B | 0 | 189 | 122939 | 297.03 | 2118 | 2068 | 406.9 |
| B | 0 | 190 | 104718 | 252.25 | 2118 | 2068 | 406.9 |
| C | 7 | 247 | 1398881 | 2856.98 | 2060 | 2051 | 488.9 |
| C | 3 | 233 | 178466 | 360.83 | 2060 | 2051 | 488.9 |
| C | 7 | 220 | 42204 | 82.13 | 2060 | 2051 | 488.9 |
| D | 8 | 195 | 1840151 | 3699.9 | 2110 | 2035 | 496.8 |
| D | 12 | 233 | 772097 | 1550.04 | 2110 | 2035 | 496.8 |
| D | 1 | 52 | 490807 | 983.84 | 2110 | 2035 | 496.8 |
Histogram calculated using DETX and DETY for each event in the final _common_clean file
| Quadrant A |  |
 |
Quadrant B |
|---|---|---|---|
| Quadrant D |  |
 |
Quadrant C |
| Plot type | Count rate plots | Images |
|---|---|---|
| Comparison with Poisson distribution Blue bars denote a histogram of data divided into 1 sec bins. Red curve is a Poisson curve with rate = median count rate of data. |
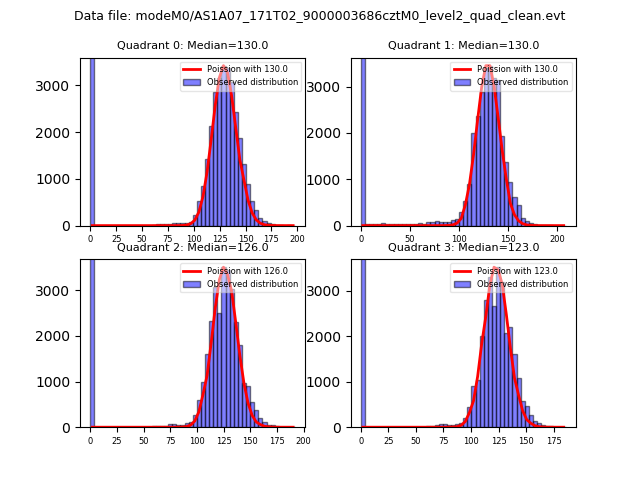 |
 |
| Quadrant-wise count rates Data is divided into 100 sec bins |
 |
|
| Module-wise count rates for Quadrant A Data is divided into 100 sec bins |
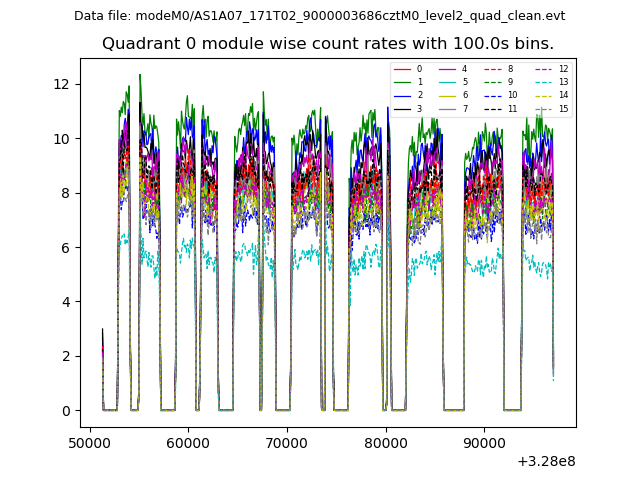 |
 |
| Module-wise count rates for Quadrant B Data is divided into 100 sec bins |
 |
 |
| Module-wise count rates for Quadrant C Data is divided into 100 sec bins |
 |
 |
| Module-wise count rates for Quadrant D Data is divided into 100 sec bins |
 |
 |
| Parameter | Plot |
|---|---|
| CZT HV Monitor | 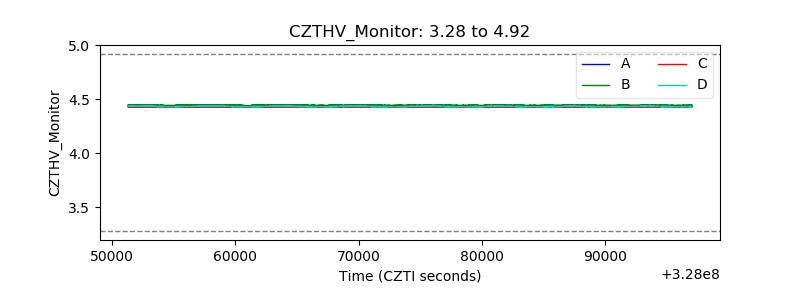 |
| D_VDD | 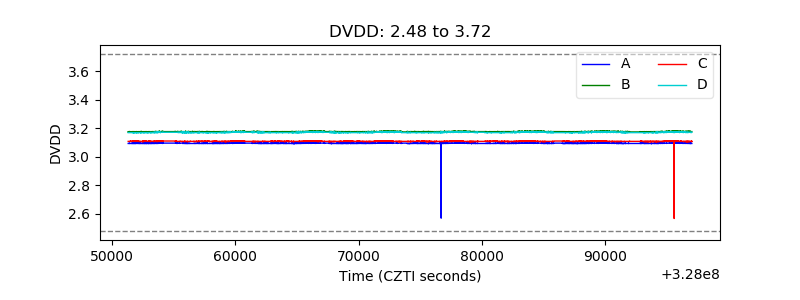 |
| Temperature 1 |  |
| Veto HV Monitor | 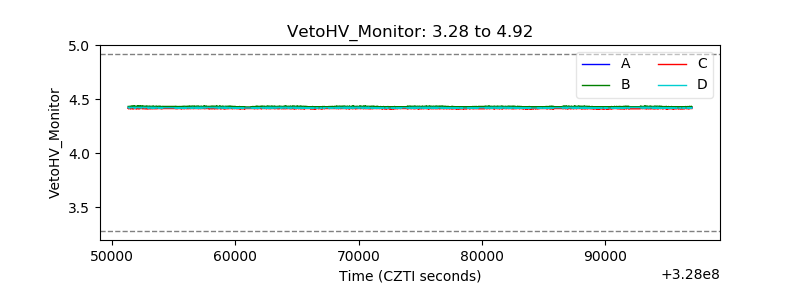 |
| Veto LLD | 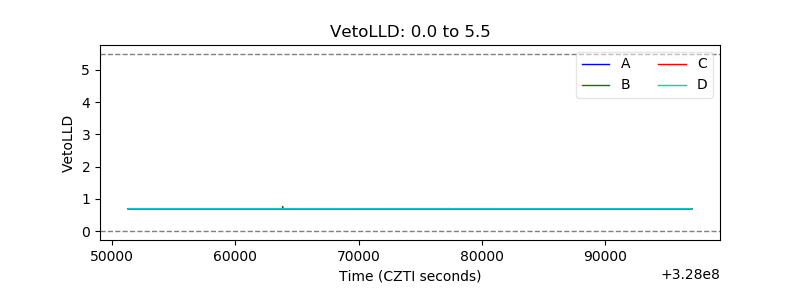 |
| Alpha Counter |  |
| _CPM_Rate |  |
| CZT Counter |  |
| +2.5 Volts monitor |  |
| +5 Volts monitor |  |
| _ROLL_ROT |  |
| _Roll_DEC |  |
| _Roll_RA |  |
| Veto Counter |  |