| Param | Original file | Final file |
|---|---|---|
| Filename | modeM0/AS1A07_018T09_9000003682cztM0_level2_bc.evt | modeM0/AS1A07_018T09_9000003682cztM0_level2_quad_clean.evt |
| Size (bytes) | 2,053,094,400 | 680,621,760 |
| Size | 1.9 GB | 649.1 MB |
| Events in quadrant A | 10,860,560 | 4,392,653 |
| Events in quadrant B | 11,349,111 | 4,456,606 |
| Events in quadrant C | 16,474,677 | 4,255,356 |
| Events in quadrant D | 20,123,626 | 4,115,687 |
| Mode SS | |||
|---|---|---|---|
| Quadrant | BADHDUFLAG | Total packets | Discarded packets |
| A | 0 | 1008 | 0 |
| B | 0 | 1008 | 0 |
| C | 0 | 1008 | 0 |
| D | 0 | 1008 | 0 |
| Mode M0 | |||
|---|---|---|---|
| Quadrant | BADHDUFLAG | Total packets | Discarded packets |
| A | 0 | 104560 | 0 |
| B | 0 | 106209 | 0 |
| C | 0 | 126593 | 0 |
| D | 0 | 136670 | 0 |
| Mode M9 | |||
|---|---|---|---|
| Quadrant | BADHDUFLAG | Total packets | Discarded packets |
| A | 0 | 97 | 0 |
| B | 0 | 97 | 0 |
| C | 0 | 97 | 0 |
| D | 0 | 97 | 0 |
| Quadrant | Total seconds | Saturated seconds | Saturation percentage |
|---|---|---|---|
| A | 49482 | 520 | 1.050887% |
| B | 49482 | 660 | 1.333818% |
| C | 49482 | 1227 | 2.479690% |
| D | 49482 | 2498 | 5.048300% |
Noise dominated data is calculated using 1-second bins in cleaned event files. If a bin has >2000 counts, and if more than 50% of those come from <1% of pixels, then it is considered to be noise-dominated and hence unusable.
| Quadrant | # 1 sec bins | Bins with >0 counts | Bins with >2000 counts | High rate bins dominated by noise | Noise dominated (total time) | Noise dominated (detector-on time) | Marked lightcurve |
|---|---|---|---|---|---|---|---|
| A | 59057 | 49474 | 0 | 0 | 0.00% | 0.00% | 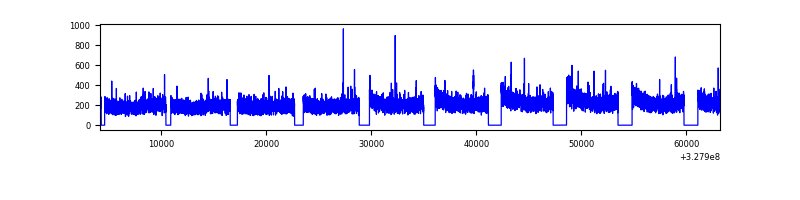 |
| B | 59057 | 49472 | 15 | 15 | 0.03% | 0.03% | 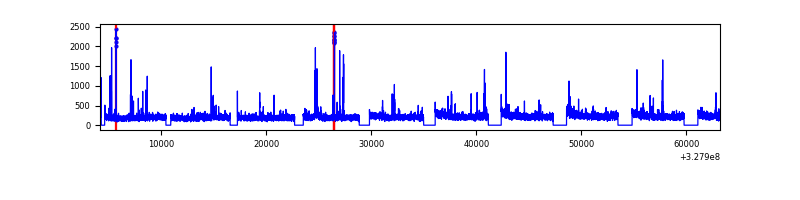 |
| C | 59057 | 49473 | 56 | 56 | 0.09% | 0.11% | 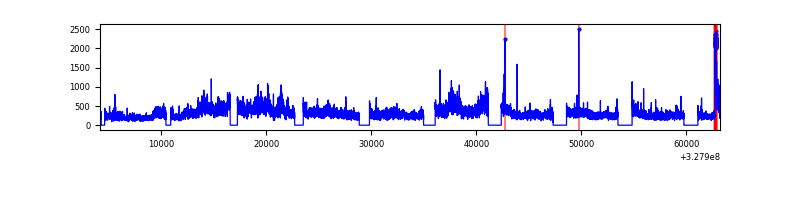 |
| D | 59057 | 49473 | 378 | 378 | 0.64% | 0.76% |  |
Top three noisy pixels from each quadrant. If the there are fewer than three noisy pixels in the level2.evt file, extra rows are filled as -1
| Pixel properties | Quadrant properties | ||||||
|---|---|---|---|---|---|---|---|
| Quadrant | DetID | PixID | Counts | Sigma | Mean | Median | Sigma |
| A | 13 | 254 | 73651 | 118.53 | 2798 | 2753 | 598.1 |
| A | 0 | 226 | 17684 | 24.96 | 2798 | 2753 | 598.1 |
| A | 12 | 194 | 17203 | 24.16 | 2798 | 2753 | 598.1 |
| B | 0 | 229 | 275580 | 523.16 | 2820 | 2758 | 521.5 |
| B | 3 | 64 | 107528 | 200.91 | 2820 | 2758 | 521.5 |
| B | 0 | 190 | 72075 | 132.92 | 2820 | 2758 | 521.5 |
| C | 7 | 247 | 5298112 | 8464.7 | 2697 | 2692 | 625.6 |
| C | 9 | 54 | 401477 | 637.46 | 2697 | 2692 | 625.6 |
| C | 7 | 87 | 251629 | 397.92 | 2697 | 2692 | 625.6 |
| D | 1 | 52 | 6774346 | 10979.83 | 2705 | 2622 | 616.7 |
| D | 8 | 195 | 1511763 | 2446.96 | 2705 | 2622 | 616.7 |
| D | 12 | 235 | 1140145 | 1844.41 | 2705 | 2622 | 616.7 |
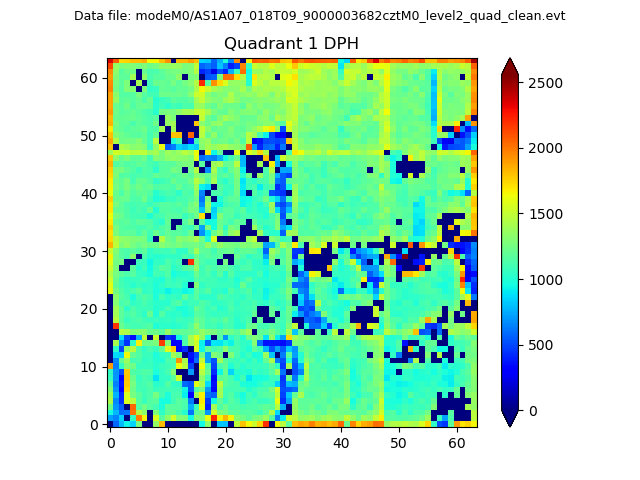
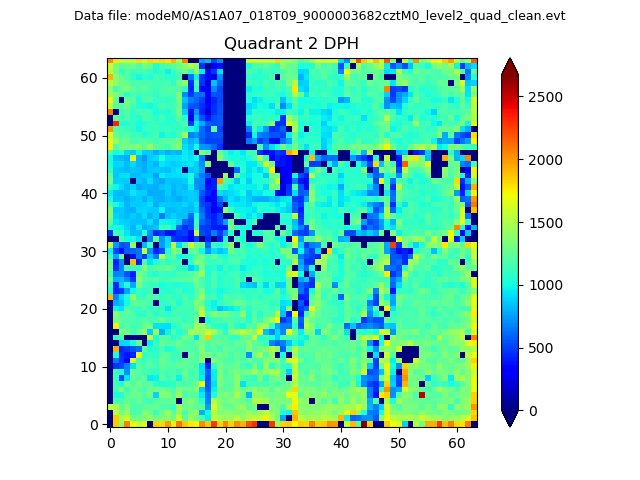
Histogram calculated using DETX and DETY for each event in the final _common_clean file
| Quadrant A |  |
 |
Quadrant B |
|---|---|---|---|
| Quadrant D |  |
 |
Quadrant C |
| Plot type | Count rate plots | Images |
|---|---|---|
| Comparison with Poisson distribution Blue bars denote a histogram of data divided into 1 sec bins. Red curve is a Poisson curve with rate = median count rate of data. |
 |
 |
| Quadrant-wise count rates Data is divided into 100 sec bins |
 |
|
| Module-wise count rates for Quadrant A Data is divided into 100 sec bins |
 |
 |
| Module-wise count rates for Quadrant B Data is divided into 100 sec bins |
 |
 |
| Module-wise count rates for Quadrant C Data is divided into 100 sec bins |
 |
 |
| Module-wise count rates for Quadrant D Data is divided into 100 sec bins |
 |
 |
| Parameter | Plot |
|---|---|
| CZT HV Monitor | 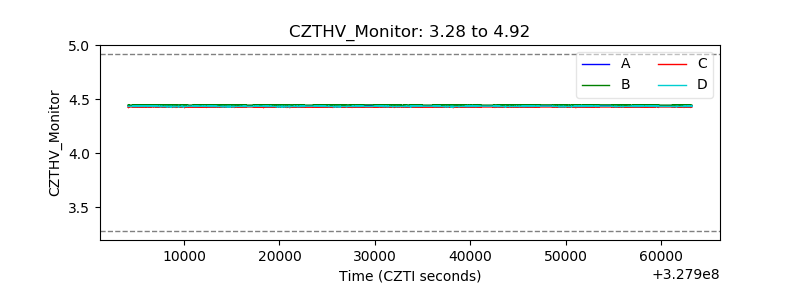 |
| D_VDD |  |
| Temperature 1 | 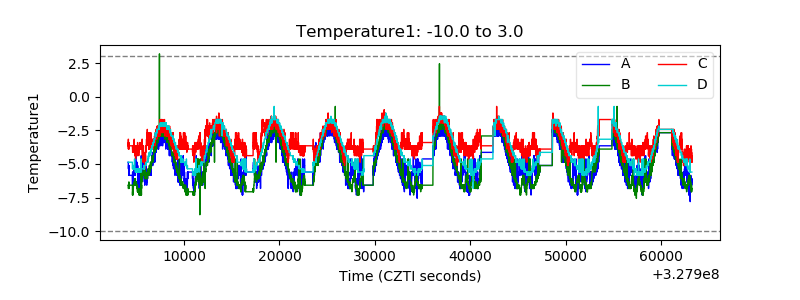 |
| Veto HV Monitor |  |
| Veto LLD | 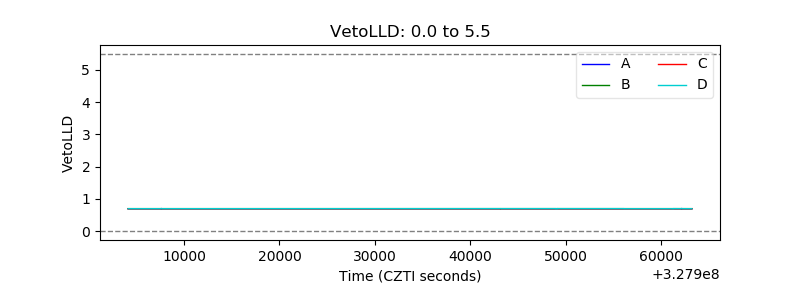 |
| Alpha Counter |  |
| _CPM_Rate |  |
| CZT Counter |  |
| +2.5 Volts monitor |  |
| +5 Volts monitor |  |
| _ROLL_ROT |  |
| _Roll_DEC |  |
| _Roll_RA | 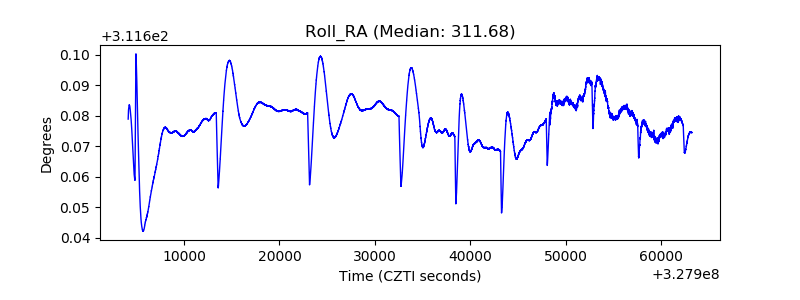 |
| Veto Counter | 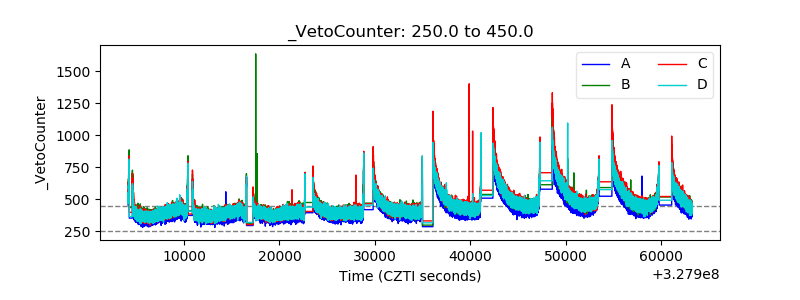 |