| Param | Original file | Final file |
|---|---|---|
| Filename | modeM0/AS1A07_018T07_9000003680cztM0_level2_bc.evt | modeM0/AS1A07_018T07_9000003680cztM0_level2_quad_clean.evt |
| Size (bytes) | 2,607,672,960 | 864,270,720 |
| Size | 2.4 GB | 824.2 MB |
| Events in quadrant A | 13,984,346 | 5,540,563 |
| Events in quadrant B | 14,367,799 | 5,641,036 |
| Events in quadrant C | 18,006,311 | 5,407,145 |
| Events in quadrant D | 28,289,755 | 5,233,114 |
| Mode SS | |||
|---|---|---|---|
| Quadrant | BADHDUFLAG | Total packets | Discarded packets |
| A | 0 | 1294 | 0 |
| B | 0 | 1294 | 0 |
| C | 0 | 1294 | 0 |
| D | 0 | 1294 | 0 |
| Mode M0 | |||
|---|---|---|---|
| Quadrant | BADHDUFLAG | Total packets | Discarded packets |
| A | 0 | 134411 | 0 |
| B | 0 | 136084 | 0 |
| C | 0 | 149997 | 0 |
| D | 0 | 182046 | 0 |
| Mode M9 | |||
|---|---|---|---|
| Quadrant | BADHDUFLAG | Total packets | Discarded packets |
| A | 0 | 110 | 0 |
| B | 0 | 110 | 0 |
| C | 0 | 110 | 0 |
| D | 0 | 110 | 0 |
| Quadrant | Total seconds | Saturated seconds | Saturation percentage |
|---|---|---|---|
| A | 63530 | 633 | 0.996380% |
| B | 63530 | 816 | 1.284433% |
| C | 63530 | 1744 | 2.745160% |
| D | 63530 | 2795 | 4.399496% |
Noise dominated data is calculated using 1-second bins in cleaned event files. If a bin has >2000 counts, and if more than 50% of those come from <1% of pixels, then it is considered to be noise-dominated and hence unusable.
| Quadrant | # 1 sec bins | Bins with >0 counts | Bins with >2000 counts | High rate bins dominated by noise | Noise dominated (total time) | Noise dominated (detector-on time) | Marked lightcurve |
|---|---|---|---|---|---|---|---|
| A | 74375 | 63524 | 22 | 22 | 0.03% | 0.03% |  |
| B | 74375 | 63519 | 7 | 7 | 0.01% | 0.01% |  |
| C | 74375 | 63523 | 206 | 206 | 0.28% | 0.32% |  |
| D | 74375 | 63521 | 895 | 895 | 1.20% | 1.41% |  |
Top three noisy pixels from each quadrant. If the there are fewer than three noisy pixels in the level2.evt file, extra rows are filled as -1
| Pixel properties | Quadrant properties | ||||||
|---|---|---|---|---|---|---|---|
| Quadrant | DetID | PixID | Counts | Sigma | Mean | Median | Sigma |
| A | 15 | 174 | 204785 | 266.3 | 3541 | 3486 | 755.9 |
| A | 13 | 254 | 97072 | 123.81 | 3541 | 3486 | 755.9 |
| A | 8 | 205 | 58713 | 73.06 | 3541 | 3486 | 755.9 |
| B | 0 | 229 | 297544 | 439.11 | 3580 | 3498 | 669.6 |
| B | 3 | 64 | 204390 | 300.0 | 3580 | 3498 | 669.6 |
| B | 0 | 190 | 67803 | 96.03 | 3580 | 3498 | 669.6 |
| C | 7 | 247 | 3745607 | 4695.39 | 3422 | 3420 | 797.0 |
| C | 9 | 54 | 428006 | 532.74 | 3422 | 3420 | 797.0 |
| C | 0 | 239 | 287950 | 357.0 | 3422 | 3420 | 797.0 |
| D | 1 | 52 | 8671595 | 11030.17 | 3450 | 3341 | 785.9 |
| D | 8 | 195 | 3192040 | 4057.55 | 3450 | 3341 | 785.9 |
| D | 12 | 235 | 1917652 | 2435.92 | 3450 | 3341 | 785.9 |
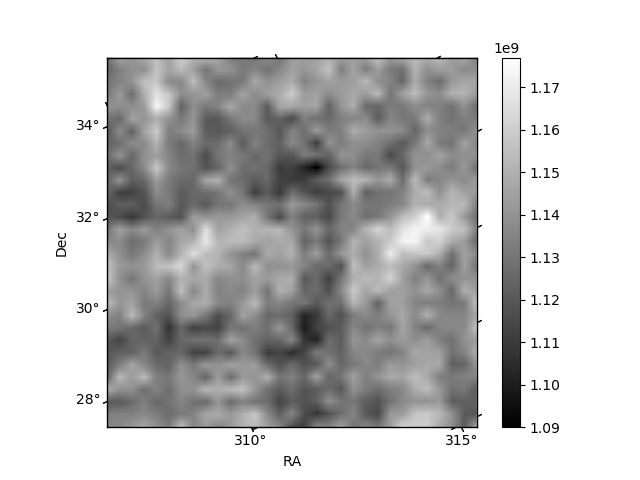
Histogram calculated using DETX and DETY for each event in the final _common_clean file
| Quadrant A | 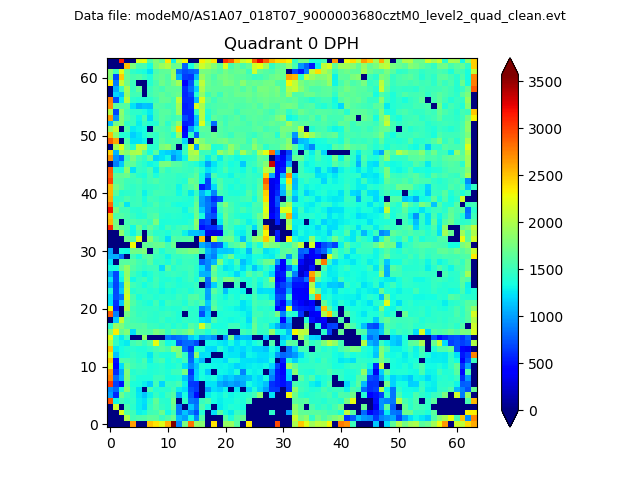 |
 |
Quadrant B |
|---|---|---|---|
| Quadrant D | 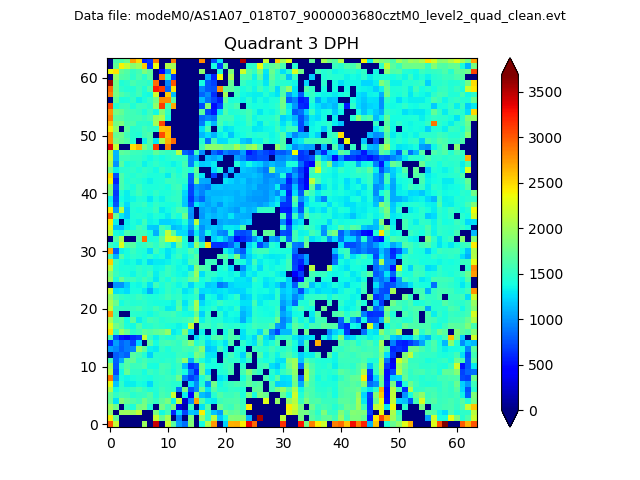 |
 |
Quadrant C |
| Plot type | Count rate plots | Images |
|---|---|---|
| Comparison with Poisson distribution Blue bars denote a histogram of data divided into 1 sec bins. Red curve is a Poisson curve with rate = median count rate of data. |
 |
 |
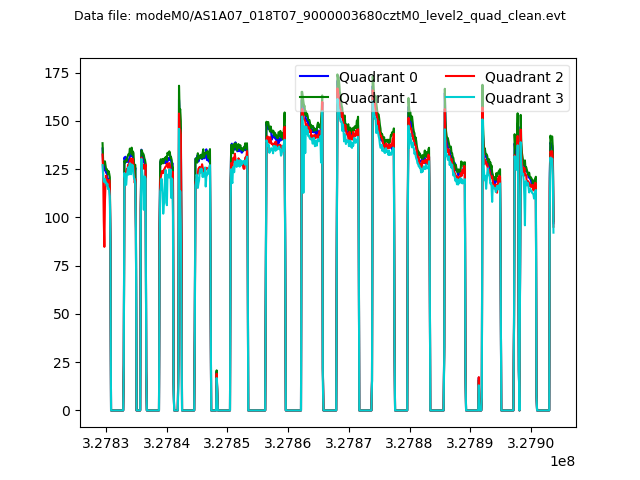
| Quadrant-wise count rates Data is divided into 100 sec bins |
 |
|
| Module-wise count rates for Quadrant A Data is divided into 100 sec bins |
 |
 |
| Module-wise count rates for Quadrant B Data is divided into 100 sec bins |
 |
 |
| Module-wise count rates for Quadrant C Data is divided into 100 sec bins |
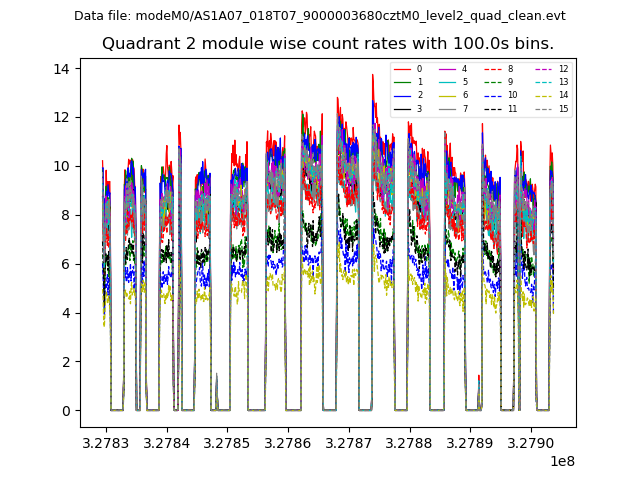 |
 |
| Module-wise count rates for Quadrant D Data is divided into 100 sec bins |
 |
 |
| Parameter | Plot |
|---|---|
| CZT HV Monitor |  |
| D_VDD | 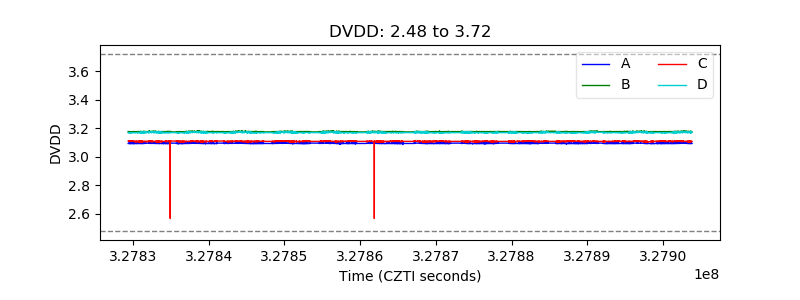 |
| Temperature 1 |  |
| Veto HV Monitor |  |
| Veto LLD |  |
| Alpha Counter | 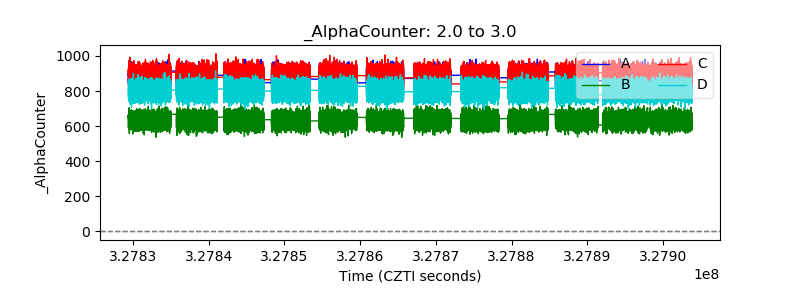 |
| _CPM_Rate | 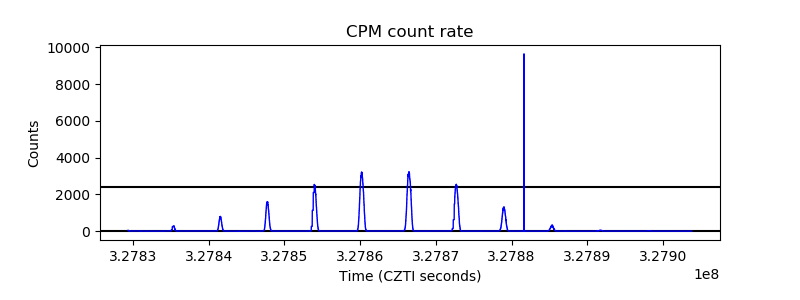 |
| CZT Counter |  |
| +2.5 Volts monitor |  |
| +5 Volts monitor |  |
| _ROLL_ROT |  |
| _Roll_DEC |  |
| _Roll_RA |  |
| Veto Counter | 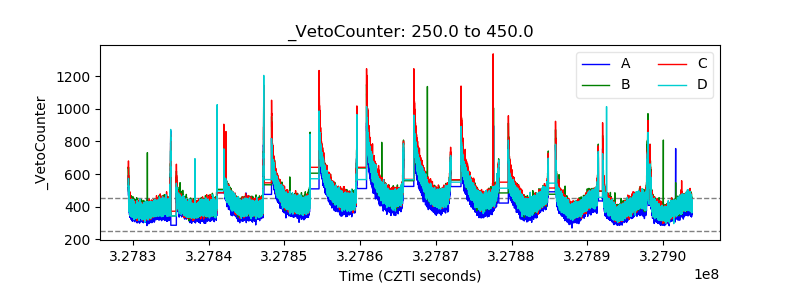 |