| Param | Original file | Final file |
|---|---|---|
| Filename | modeM0/AS1A08_003T16_9000003676cztM0_level2_bc.evt | modeM0/AS1A08_003T16_9000003676cztM0_level2_quad_clean.evt |
| Size (bytes) | 1,176,528,960 | 349,099,200 |
| Size | 1.1 GB | 332.9 MB |
| Events in quadrant A | 5,337,175 | 2,328,743 |
| Events in quadrant B | 5,548,483 | 2,352,196 |
| Events in quadrant C | 7,720,556 | 2,219,811 |
| Events in quadrant D | 15,402,985 | 2,036,489 |
| Mode M9 | |||
|---|---|---|---|
| Quadrant | BADHDUFLAG | Total packets | Discarded packets |
| A | 0 | 59 | 0 |
| B | 0 | 59 | 0 |
| C | 0 | 59 | 0 |
| D | 0 | 59 | 0 |
| Mode SS | |||
|---|---|---|---|
| Quadrant | BADHDUFLAG | Total packets | Discarded packets |
| A | 0 | 484 | 0 |
| B | 0 | 484 | 0 |
| C | 0 | 484 | 0 |
| D | 0 | 484 | 0 |
| Mode M0 | |||
|---|---|---|---|
| Quadrant | BADHDUFLAG | Total packets | Discarded packets |
| A | 0 | 50680 | 0 |
| B | 0 | 51386 | 0 |
| C | 0 | 60354 | 0 |
| D | 0 | 84201 | 0 |
| Quadrant | Total seconds | Saturated seconds | Saturation percentage |
|---|---|---|---|
| A | 23785 | 282 | 1.185621% |
| B | 23785 | 323 | 1.357999% |
| C | 23785 | 522 | 2.194661% |
| D | 23784 | 2547 | 10.708880% |
Noise dominated data is calculated using 1-second bins in cleaned event files. If a bin has >2000 counts, and if more than 50% of those come from <1% of pixels, then it is considered to be noise-dominated and hence unusable.
| Quadrant | # 1 sec bins | Bins with >0 counts | Bins with >2000 counts | High rate bins dominated by noise | Noise dominated (total time) | Noise dominated (detector-on time) | Marked lightcurve |
|---|---|---|---|---|---|---|---|
| A | 29610 | 23782 | 0 | 0 | 0.00% | 0.00% |  |
| B | 29610 | 23780 | 8 | 8 | 0.03% | 0.03% |  |
| C | 29610 | 23781 | 0 | 0 | 0.00% | 0.00% |  |
| D | 29609 | 23779 | 1218 | 1218 | 4.11% | 5.12% |  |
Top three noisy pixels from each quadrant. If the there are fewer than three noisy pixels in the level2.evt file, extra rows are filled as -1
| Pixel properties | Quadrant properties | ||||||
|---|---|---|---|---|---|---|---|
| Quadrant | DetID | PixID | Counts | Sigma | Mean | Median | Sigma |
| A | 13 | 254 | 36678 | 119.28 | 1382 | 1360 | 296.1 |
| A | 0 | 226 | 8857 | 25.32 | 1382 | 1360 | 296.1 |
| A | 12 | 194 | 8380 | 23.71 | 1382 | 1360 | 296.1 |
| B | 3 | 64 | 129688 | 499.76 | 1388 | 1357 | 256.8 |
| B | 0 | 190 | 29696 | 110.36 | 1388 | 1357 | 256.8 |
| B | 10 | 251 | 28722 | 106.57 | 1388 | 1357 | 256.8 |
| C | 7 | 247 | 2572678 | 8257.08 | 1321 | 1317 | 311.4 |
| C | 7 | 220 | 41923 | 130.39 | 1321 | 1317 | 311.4 |
| C | 3 | 233 | 22989 | 69.59 | 1321 | 1317 | 311.4 |
| D | 1 | 52 | 5702919 | 18918.4 | 1302 | 1261 | 301.4 |
| D | 12 | 235 | 1780442 | 5903.42 | 1302 | 1261 | 301.4 |
| D | 8 | 195 | 1718088 | 5696.52 | 1302 | 1261 | 301.4 |
Histogram calculated using DETX and DETY for each event in the final _common_clean file
| Quadrant A |  |
 |
Quadrant B |
|---|---|---|---|
| Quadrant D |  |
 |
Quadrant C |
| Plot type | Count rate plots | Images |
|---|---|---|
| Comparison with Poisson distribution Blue bars denote a histogram of data divided into 1 sec bins. Red curve is a Poisson curve with rate = median count rate of data. |
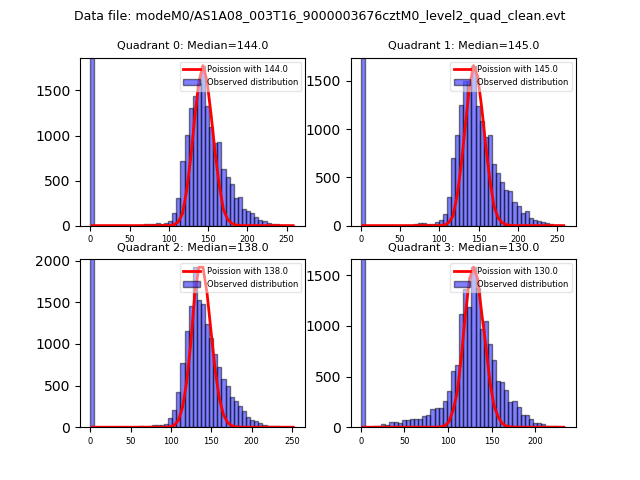 |
 |
| Quadrant-wise count rates Data is divided into 100 sec bins |
 |
|
| Module-wise count rates for Quadrant A Data is divided into 100 sec bins |
 |
 |
| Module-wise count rates for Quadrant B Data is divided into 100 sec bins |
 |
 |
| Module-wise count rates for Quadrant C Data is divided into 100 sec bins |
 |
 |
| Module-wise count rates for Quadrant D Data is divided into 100 sec bins |
 |
 |
| Parameter | Plot |
|---|---|
| CZT HV Monitor |  |
| D_VDD |  |
| Temperature 1 |  |
| Veto HV Monitor |  |
| Veto LLD |  |
| Alpha Counter |  |
| _CPM_Rate |  |
| CZT Counter |  |
| +2.5 Volts monitor |  |
| +5 Volts monitor |  |
| _ROLL_ROT | 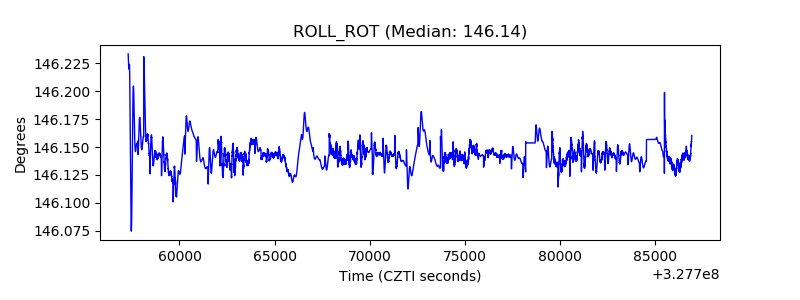 |
| _Roll_DEC |  |
| _Roll_RA |  |
| Veto Counter |  |