| Param | Original file | Final file |
|---|---|---|
| Filename | modeM0/AS1A07_091T03_9000003678cztM0_level2_bc.evt | modeM0/AS1A07_091T03_9000003678cztM0_level2_quad_clean.evt |
| Size (bytes) | 1,350,380,160 | 444,600,000 |
| Size | 1.3 GB | 424.0 MB |
| Events in quadrant A | 6,978,161 | 2,850,307 |
| Events in quadrant B | 7,287,989 | 2,883,189 |
| Events in quadrant C | 8,973,881 | 2,758,006 |
| Events in quadrant D | 15,334,442 | 2,637,226 |
| Mode M9 | |||
|---|---|---|---|
| Quadrant | BADHDUFLAG | Total packets | Discarded packets |
| A | 0 | 41 | 0 |
| B | 0 | 41 | 0 |
| C | 0 | 41 | 0 |
| D | 0 | 41 | 0 |
| Mode M0 | |||
|---|---|---|---|
| Quadrant | BADHDUFLAG | Total packets | Discarded packets |
| A | 0 | 70430 | 0 |
| B | 0 | 71608 | 0 |
| C | 0 | 76762 | 0 |
| D | 0 | 98625 | 0 |
| Mode SS | |||
|---|---|---|---|
| Quadrant | BADHDUFLAG | Total packets | Discarded packets |
| A | 0 | 696 | 0 |
| B | 0 | 696 | 0 |
| C | 0 | 696 | 0 |
| D | 0 | 696 | 0 |
| Quadrant | Total seconds | Saturated seconds | Saturation percentage |
|---|---|---|---|
| A | 34009 | 323 | 0.949749% |
| B | 34010 | 480 | 1.411350% |
| C | 34010 | 627 | 1.843575% |
| D | 34010 | 2524 | 7.421347% |
Noise dominated data is calculated using 1-second bins in cleaned event files. If a bin has >2000 counts, and if more than 50% of those come from <1% of pixels, then it is considered to be noise-dominated and hence unusable.
| Quadrant | # 1 sec bins | Bins with >0 counts | Bins with >2000 counts | High rate bins dominated by noise | Noise dominated (total time) | Noise dominated (detector-on time) | Marked lightcurve |
|---|---|---|---|---|---|---|---|
| A | 38315 | 34010 | 0 | 0 | 0.00% | 0.00% | 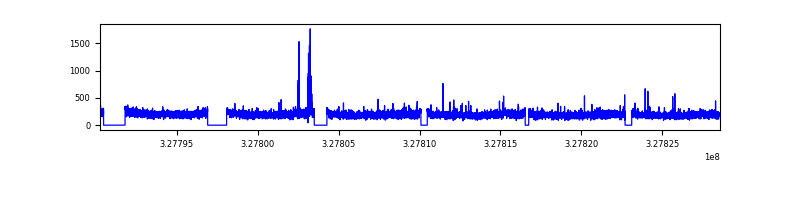 |
| B | 38316 | 34011 | 5 | 5 | 0.01% | 0.01% | 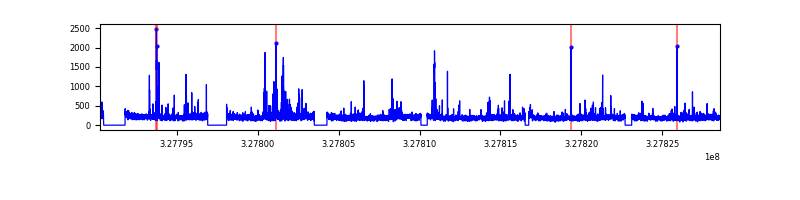 |
| C | 38316 | 34009 | 8 | 8 | 0.02% | 0.02% |  |
| D | 38316 | 34011 | 703 | 703 | 1.83% | 2.07% |  |
Top three noisy pixels from each quadrant. If the there are fewer than three noisy pixels in the level2.evt file, extra rows are filled as -1
| Pixel properties | Quadrant properties | ||||||
|---|---|---|---|---|---|---|---|
| Quadrant | DetID | PixID | Counts | Sigma | Mean | Median | Sigma |
| A | 15 | 174 | 88978 | 226.6 | 1779 | 1746 | 385.0 |
| A | 13 | 254 | 49856 | 124.98 | 1779 | 1746 | 385.0 |
| A | 0 | 226 | 11153 | 24.44 | 1779 | 1746 | 385.0 |
| B | 10 | 246 | 147380 | 426.08 | 1791 | 1745 | 341.8 |
| B | 3 | 64 | 87484 | 250.85 | 1791 | 1745 | 341.8 |
| B | 0 | 190 | 66189 | 188.54 | 1791 | 1745 | 341.8 |
| C | 7 | 247 | 2216978 | 5429.81 | 1719 | 1708 | 408.0 |
| C | 9 | 54 | 65346 | 155.98 | 1719 | 1708 | 408.0 |
| C | 3 | 233 | 41312 | 97.07 | 1719 | 1708 | 408.0 |
| D | 1 | 52 | 6275194 | 15570.88 | 1708 | 1647 | 402.9 |
| D | 8 | 195 | 1493520 | 3702.81 | 1708 | 1647 | 402.9 |
| D | 2 | 244 | 407181 | 1006.53 | 1708 | 1647 | 402.9 |
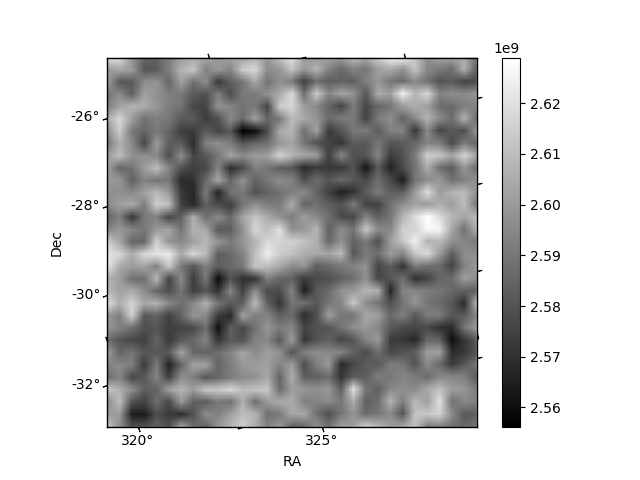
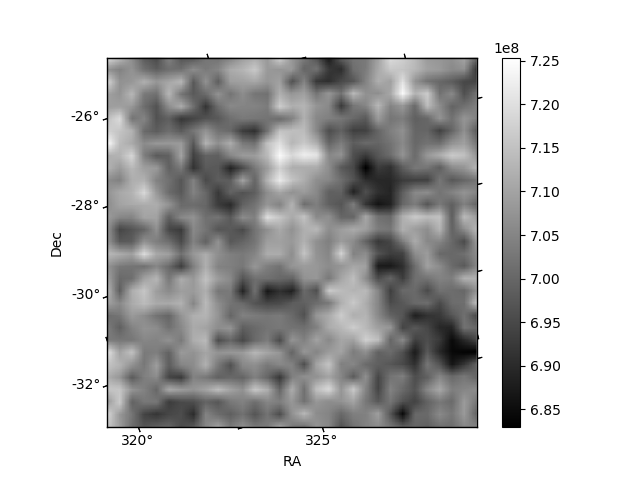
Histogram calculated using DETX and DETY for each event in the final _common_clean file
| Quadrant A |  |
 |
Quadrant B |
|---|---|---|---|
| Quadrant D |  |
 |
Quadrant C |
| Plot type | Count rate plots | Images |
|---|---|---|
| Comparison with Poisson distribution Blue bars denote a histogram of data divided into 1 sec bins. Red curve is a Poisson curve with rate = median count rate of data. |
 |
 |
| Quadrant-wise count rates Data is divided into 100 sec bins |
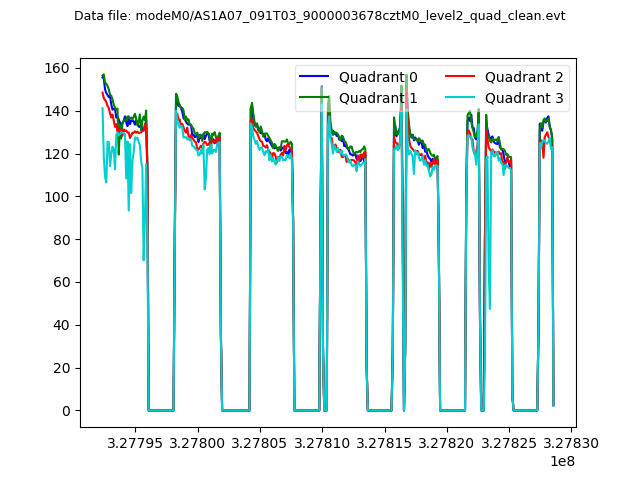 |
|
| Module-wise count rates for Quadrant A Data is divided into 100 sec bins |
 |
 |
| Module-wise count rates for Quadrant B Data is divided into 100 sec bins |
 |
 |
| Module-wise count rates for Quadrant C Data is divided into 100 sec bins |
 |
 |
| Module-wise count rates for Quadrant D Data is divided into 100 sec bins |
 |
 |
| Parameter | Plot |
|---|---|
| CZT HV Monitor |  |
| D_VDD |  |
| Temperature 1 |  |
| Veto HV Monitor |  |
| Veto LLD | 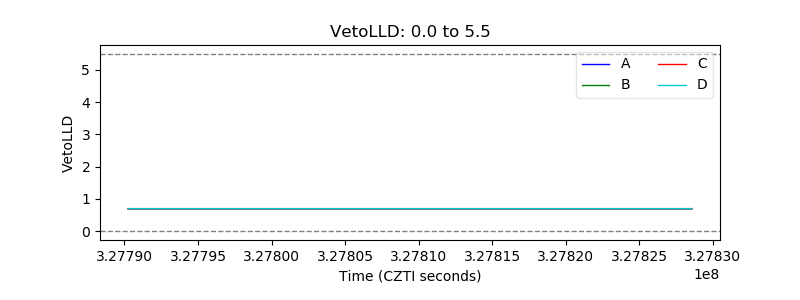 |
| Alpha Counter |  |
| _CPM_Rate |  |
| CZT Counter | 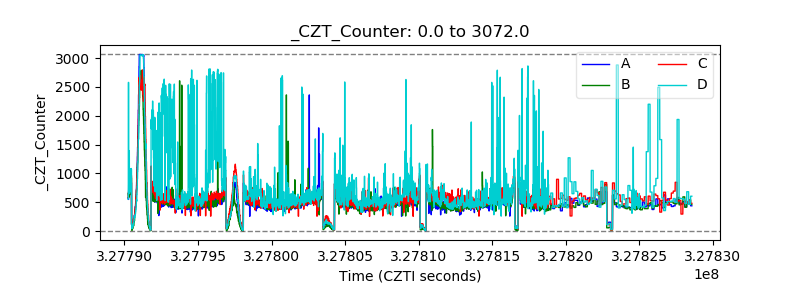 |
| +2.5 Volts monitor |  |
| +5 Volts monitor | 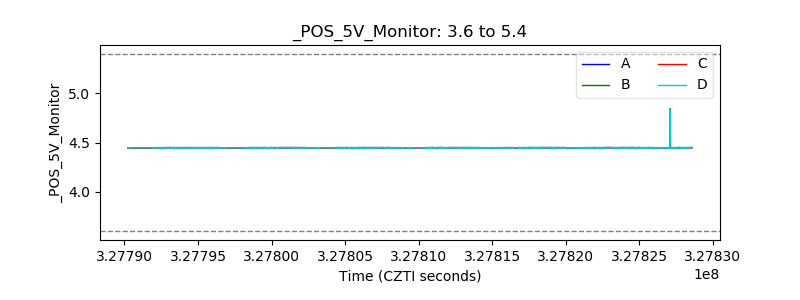 |
| _ROLL_ROT |  |
| _Roll_DEC |  |
| _Roll_RA |  |
| Veto Counter |  |